
|
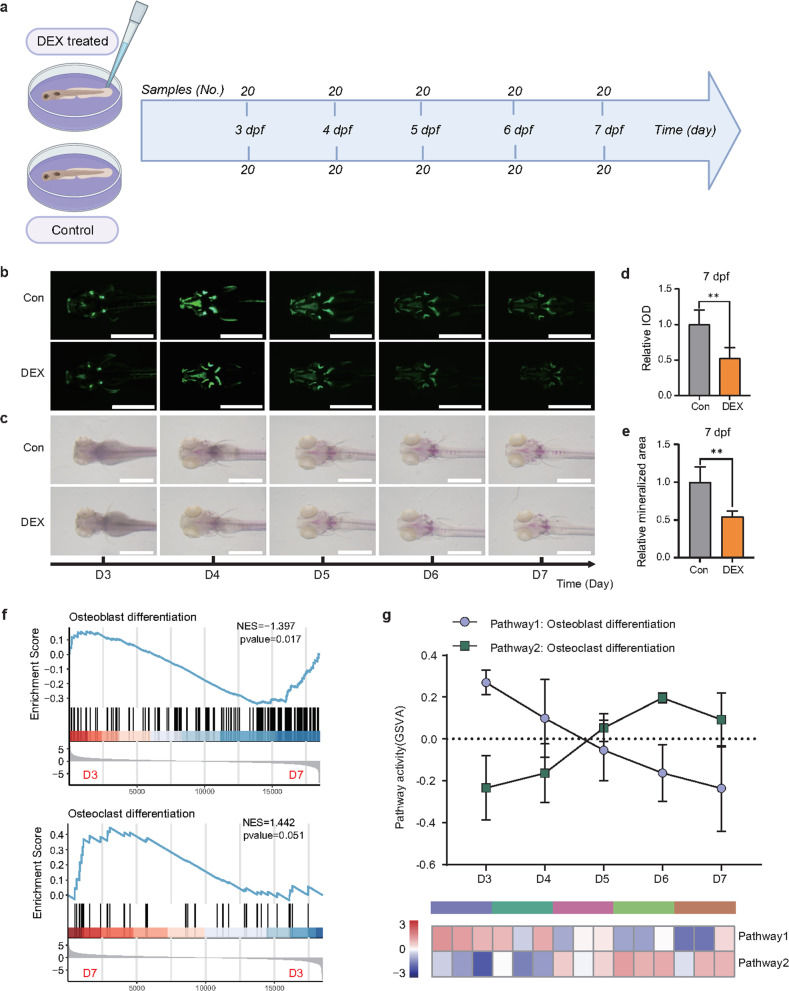
Fig. 1
a The flowchart demonstrates the process of establishing a zebrafish osteoporosis model. Zebrafish larvae (n = 20) were exposed to 10 µM dexamethasone (DEX) from D3 to D7. b Fluorescence images in each of the osteoporotic zebrafish labeled with sp7 from D3 to D7 after the addition of DEX. Scale bars: 1 mm. c Alizarin red staining images in each of the osteoporotic zebrafish from D3 to D7 after the addition of DEX. Scale bars: 1 mm. d, e Semiquantitative analysis of the mineralized area and integrated optical density (IOD) at 7 days post-fertilization (dpf). f Gene set enrichment analysis (GSEA) of the osteoblastic (upper panel)/osteoclastic (bottom panel) differentiation signature was performed from the transcriptomes of the DEX-treated zebrafish obtained from D3 and D7. g The gene set variation analysis (GSVA) algorithm estimates the variation in osteoblastic/osteoclastic differentiation pathway activity over that of the DEX-treated zebrafish obtained from D3 to D7. **P < 0.01, Student’s t-test.