
Image
|
Figure Caption
Figure 4
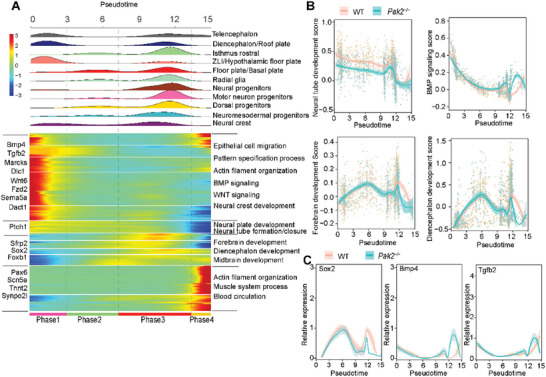
Abnormal transcriptional changes along with abnormal developmental process in Pak2 ?/? embryos. A) Heatmap showed the dynamic changes in gene expression along the pseudotime (lower panel). Cell types are labeled by colors (upper panel). B) 2D plots show the expression scores related to neural tube development, BMP signaling, forebrain development, and diencephalon development along the pseudotime. C) 2D plots show the dynamic expression of representative genes during neural tube development along the pseudotime.
Acknowledgments
This image is the copyrighted work of the attributed author or publisher, and
ZFIN has permission only to display this image to its users.
Additional permissions should be obtained from the applicable author or publisher of the image.
Full text @ Adv Sci (Weinh)