
|
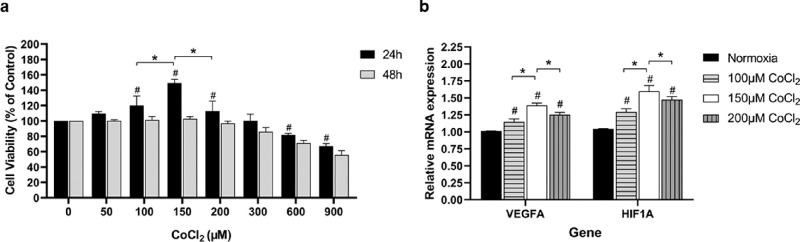
Fig. 1
Determination of CoCl2 concentration for the cell hypoxia model. (A) Cell proliferation was tested by CCK-8 assay. The 0nM CoCl2 treated group was chosen as control. (B) The mRNA expression of VEGFA and HIF1A in HRVECs was tested after 24 hours of CoCl2 exposure. Values are expressed as the mean � SD. VEGFA, vascular endothelial growth factor A; HIF1A, hypoxia-inducible factor 1-alpha. Normoxia group was set as the control at 100%. * Significant difference among CoCl2 with various concentrations (100 �M, 150 �M, and 200 �M; paired t-test, P < 0.05). # Significant difference of CoCl2 groups (100 �M, 150 �M, and 200 �M) compared with the control normoxia group (paired t-test, P values < 0.05).