Fig. 3
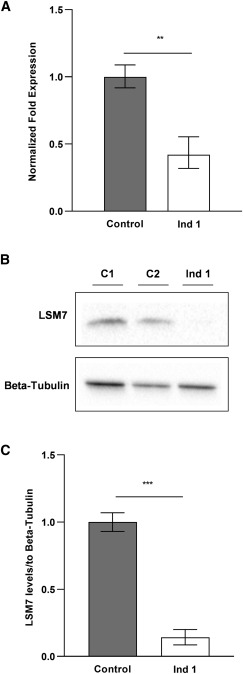
Figure 3. LSM7 mRNA and protein levels are decreased in individual 1 compared to control individuals
(A) RT-qPCR analysis of LSM7 mRNA extracted from individual 1’s fibroblasts and two age- and sex-matched control individuals (n = 6). The results are represented in terms of fold change after normalizing to RPL30 and SDHA mRNAs. Each value represents the mean ± SEM (unpaired t test [two tailed] ∗∗p < 0.01).
(B) Total protein lysates extracted from individual 1 and age- and sex-matched control individual fibroblasts were immunoblotted with anti-LSM7 and anti-beta-tubulin.
(C) The pixel densities of immunoblot bands from at least 3 independent replicates were quantified using ImageJ software, normalized over beta-tubulin immunoblot and represented as mean ± SEM (unpaired t test [two tailed], ∗∗∗p < 0.001).

