IMAGE

FIGURE 2

ID
ZDB-IMAGE-230131-36
Source
Figures for Chu et al., 2023
Image
Figure Caption

FIGURE 2

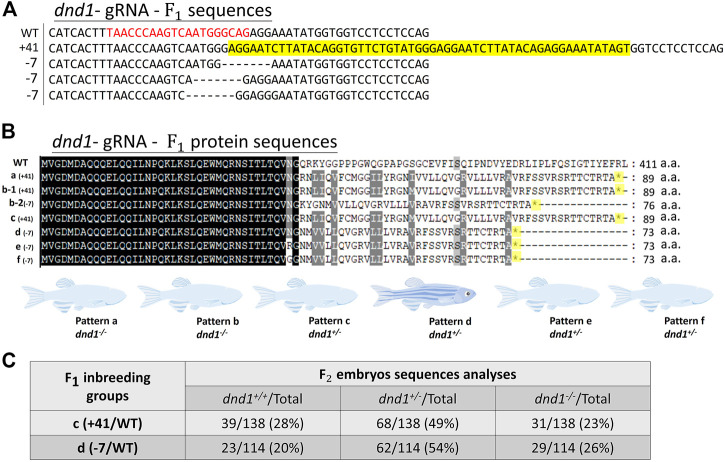
(A) Mutation sequences identified in the F1 generation by sequencing. The analyzed individuals are shown in order of the mutation sequence size of the insertions (+)/deletions (−). The target site of gRNA is indicated by red characters, and the yellow highlighted sequences are insertional sequences. (B) Mutation amino acid sequences identified in each F1 zebrafish by genotyping. The in-frame stop codon is shown as * and highlighted in yellow. (C) Analysis of the ratio of different genotypes in F2 generation.

Acknowledgments
This image is the copyrighted work of the attributed author or publisher, and ZFIN has permission only to display this image to its users. Additional permissions should be obtained from the applicable author or publisher of the image. Full text @ Front Genet