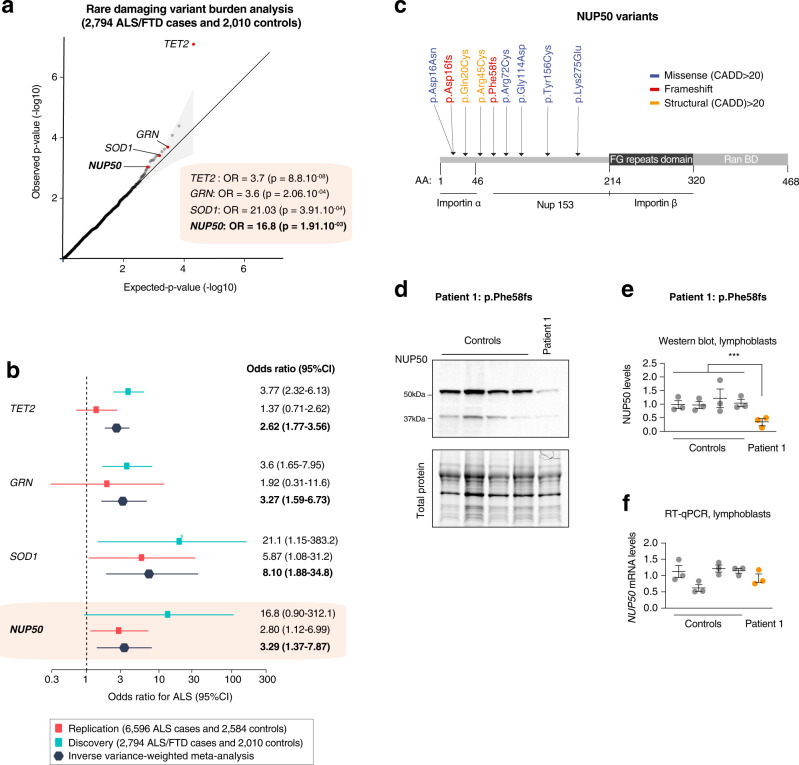
Fig. 3
a Rare damaging variants in the replication ALS dataset. The x- and y-axis represent the negative logarithm P value (?log(P); n = 2794 ALS/FTD cases, n = 2010 controls). Q?Q plot depicting on x-axis the ?log 10 of expected p value versus the actually measured p values from firth logistic regression for 10,182 genes. Exome-wide correction for multiple testing was set at P < 2.5 × 10?6, Bonferroni p < 0.05. Genes in red are genome-wide significant. Genes in blue are ALS/FTD known genes and candidate gene NUP50 at suggestive p-value < 1 × 10?3. b Analysis of candidates and ALS genes only. Forest plot display per-cohort association in discovery (6596 cases and 2584 controls) and replication (2794 ALS/FTD cases and 2010 controls). OR values and 95% CI for each cohort and meta-analysis are depicted in different color. The graphs display the means and 95% confidence interval. c High confidence NUP50 variants with a CADD (combined annotation-dependent depletion) score >20 are indicated. Most of these variants are located in or near the importin alpha domain of the NUP50 protein suggesting a role in nucleo-cytoplasmic transport. d?f NUP50 expression analysis in lymphoblasts from n = 4 healthy donors and n = 1 patient carrying the NUP50 frameshift Phe58fs mutation. Data are presented as mean values ± SEM n = 3 biologically independent experiments, each performed in triplicate. The mean value of each biological replicate is indicated by a dot on the scatter plot in (e, f). Western blotting (b, c) shows a significant decrease in NUP50 protein levels (One way ANOVA: F(1,13) = 12.5, p = 0.00365, Control ~ Patient: post-hoc Tukey, adjusted-p = **0.00367). However, we observed no significant changes in NUP50 mRNA expression (d, Nested t test t = 0.20955, p = 0.8348).

