
|
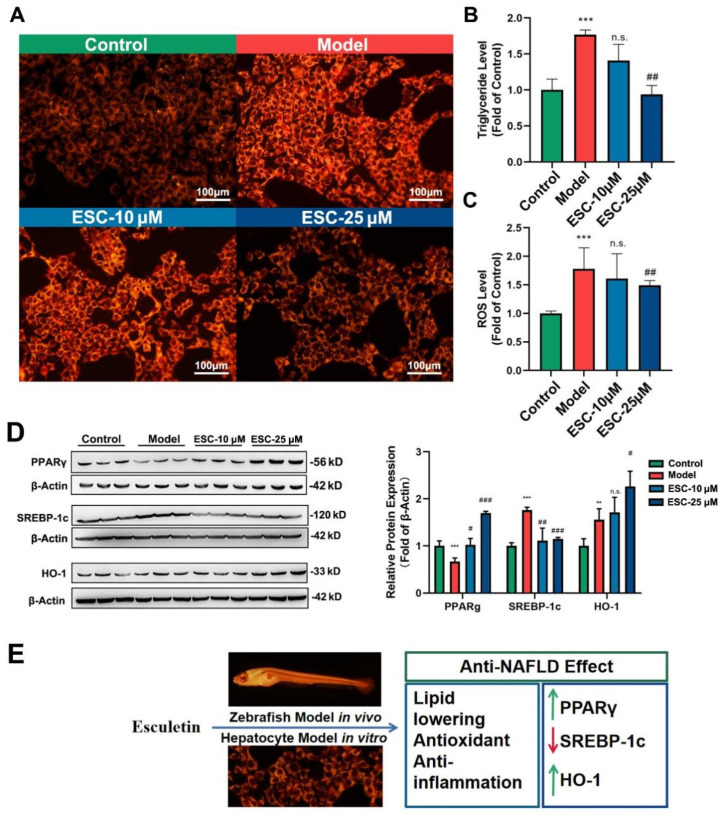
Figure 4
Effects of ESC on FFA−induced BRL−3A hepatocyte in vitro. (A) The BRL−3A hepatocyte stained with nile red. (B) The Triglyceride (TG) level of BRL-3A hepatocyte. (C) The ROS level of BRL−3A hepatocyte. (D) Western blot and relative protein expression of BRL−3A hepatocyte. (