
|
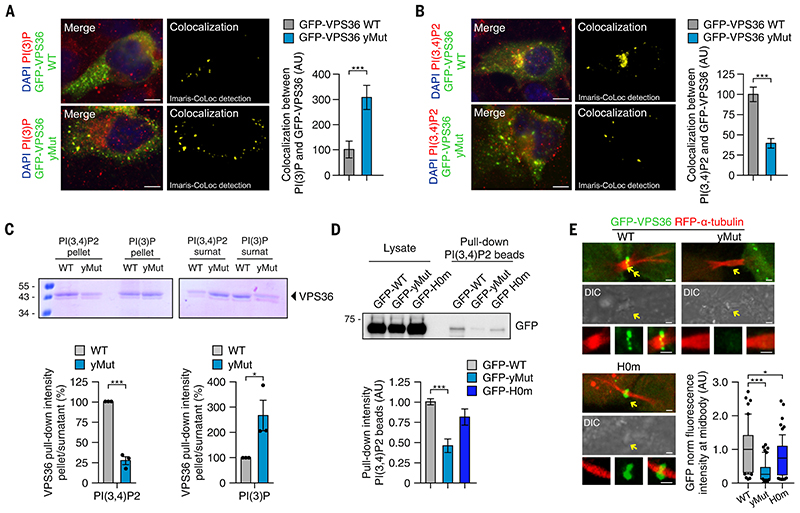
Fig. 6
(A and B) (Left) Immunofluorescence and (right) quantification by using Imaris software of the colocalization between GFP-VPS36 WT or GFP-VPS36-yMut with either (A) PI(3)P or (B) PI(3,4)P2. (C) Lipid sedimentation assay showing binding of WT and yMut VPS36 to PI(3,4)P2 and PI(3)P. (D) Pull-down experiment by using PI(3,4)P2?coated beads and lysates from cells expressing WT, yMut, or H0m VPS36. (E) Time-lapse of HeLa cells stably expressing RFP?a-tubulin, showing localization of WT, H0m, or yMut VPS36 enrichment at the midbody during abscission. Quantification reports the average fluorescence intensity observed in n ? 60 cells and normalized on total GFP fluorescence inside each cell (mean � SD). If not previously specified, all results are shown as mean or representative picture of at least three independent experiments � SEM. *P < 0.05; ***P < 0.001.