
|
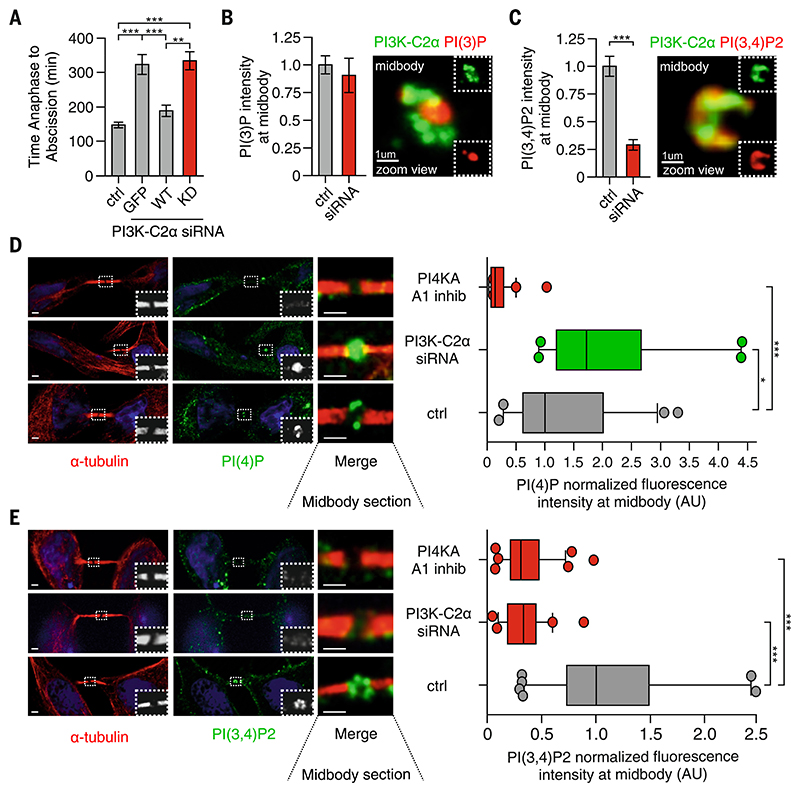
Fig. 3
(A) Time-lapse microscopy measuring the time required to progress from anaphase to abscission in HeLa cells treated with siRNA for PI3K-C2? alone or expressing GFP and siRNA-resistant GFP?wild-type (WT) or GFP-kinase inactive (KD) form of PI3K-C2?. n ? 25 cells imaged. (B) (Left) Quantification of PI(3)P levels at midbody by means of immunofluorescence staining (n ?100 cells) and (right) confocal image of 3D reconstructed midbody stained for PI(3)P (red) and PI3K-C2? (green). (C) (Left) Quantification of PI(3,4)P2 levels at midbody by immunofluorescence staining (n ?100 cells) and (right) confocal image of 3D reconstructed midbody stained for PI(3,4)P2 (red) and PI3K-C2? (green). (D) Quantification of PI(4)P levels at midbody in control, A1 inhibitor, and siRNA-treated cells. n ?100 cells, mean � SD. (E) Quantification of PI(3,4)P2 levels at midbody in control, A1 inhibitor, and siRNA-treated cells. n ?100 cells, mean � SD. If not previously specified, all results are shown as mean or representative picture of at least three independent experiments � SEM. *P < 0.05; **P < 0.01; ***P < 0.001.