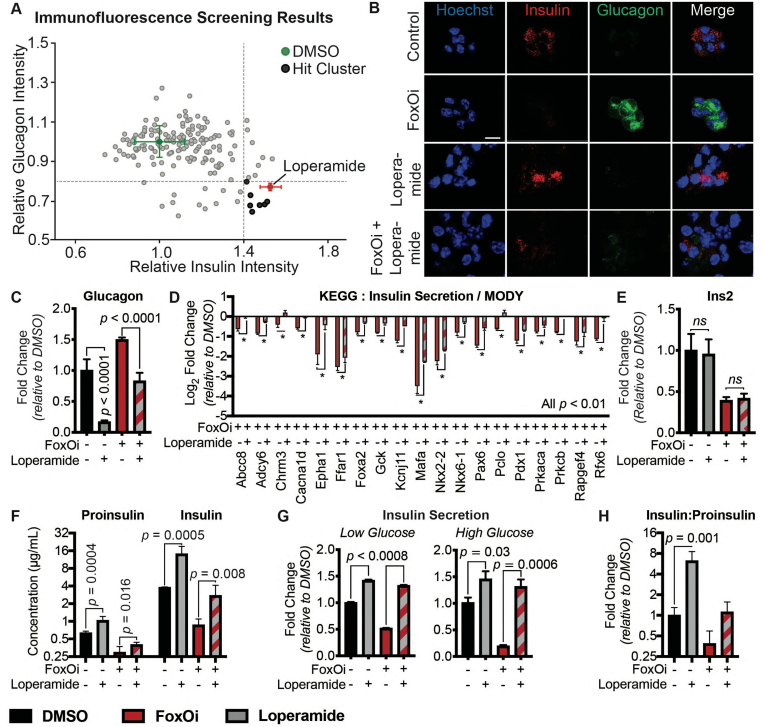
Fig. 2 High-content screen identifies loperamide to counter aspects of FoxOi-mediated beta-cell dedifferentiation.A. Overview of the small-molecule screening results. All the results were normalized to the DMSO control. Each dot represents the mean value of three replicates. Results whose standard deviations were more than 20% of the mean values were removed. Compounds that decreased mean cell numbers by more than 20% were considered cytotoxic and were also removed. Hit cluster = all compounds that yielded a greater than 1.5-fold increase in insulin intensity. B. Representative images of Min6 cells treated with/without FoxO inhibitor in combination with loperamide (5 ?M unless otherwise stated). Scale bar = 10 ?m. C. Loperamide suppresses FoxOi-induced glucagon transcription in Min6 cells, as measured by RNAseq with fragments per kilobase of transcript per million mapped reads (FPKM). D. Rescue of the expression of genes involved in insulin secretion with loperamide in Min6 cells treated with FoxOi for 48h, as measured by RNAseq. E. Loperamide does not affect insulin mRNA levels, as measured by RNAseq. F. Intracellular insulin and proinsulin protein concentrations in Min6 cells following 48h FoxOi/loperamide treatment, as measured by ELISA. G. Insulin secretion from Min6 cells in low (0.3 g/L) and high (3 g/L) glucose medium pretreated with FoxOi and loperamide for 48h. H. Insulin to proinsulin total protein ratio following 48h FoxOi/loperamide treatment, relative to DMSO control, measured by ELISA.
Image
Figure Caption
Acknowledgments
This image is the copyrighted work of the attributed author or publisher, and
ZFIN has permission only to display this image to its users.
Additional permissions should be obtained from the applicable author or publisher of the image.
Full text @ Mol Metab

