Fig. 1
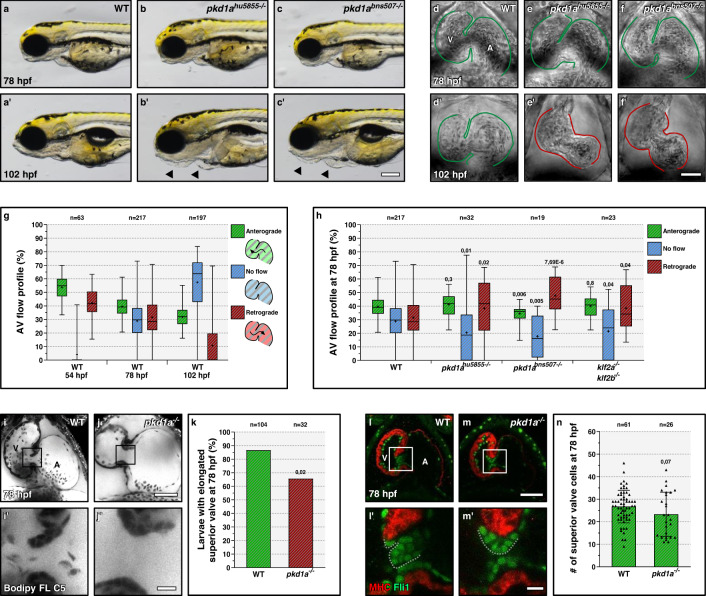
a?c? Wild-type (a-a?) like morphology of pkd1ahu5855 (b-b?) and pkd1abns507 (c-c?) mutants at 78 but not 102 hpf; arrows point to craniofacial defects and pericardial edema. d?f? Brightfield images of 78 and 102 hpf wild-type (d-d?), pkd1ahu5855 mutant (e-e?), and pkd1abns507 mutant (f-f?) hearts; one time point of a spinning disc movie at atrial diastole; green and red lines outline the heart. g AV flow profile of 54, 78, and 102 hpf wild-type zebrafish; average profile of three cardiac cycles per zebrafish. h AV flow profile of 78 hpf wild-type, pkd1ahu5855 mutant, pkd1abns507 mutant, and klf2a; klf2b double mutant larvae; average profile of three cardiac cycles per zebrafish. i?j? Confocal imaging of 78 hpf wild-type (i-i?) and pkd1a mutant (j-j?) hearts stained with Bodipy FL C5-Ceramide; i?, j? are AV canal magnified images of i, j. k Superior AV valve elongation of 78 hpf wild-type and pkd1a mutant larvae. l?m? Confocal imaging of 78 hpf wild-type (l-l?) and pkd1a mutant (m-m?) hearts immunostained for MHC and Fli1; l?,m? are AV canal magnified images of l,l. n Superior AV valve cell number in 78 hpf wild types and pkd1a mutants. Hearts imaged in ventral view, anterior to the top, ventricle (V) on the left, and atrium (A) on the right. The center of the box-and-whisker plots represents the median; each of the box-and-whiskers represents a quartile; ?+? represents the mean in g, h. The center of the error bar represents the mean in k, n. Error bars indicate s.d in n. P values were calculated using a two-sided Student?s t-test in g, h, n; a two-sided Fisher?s exact test in k; and are relative to wild type. Scale bars: 200 Ám in a?c?; 50 Ám in d?f?, i, j, l, m; 10 Ám in i?, j?, l?, m?. Source data are provided as a Source Data file.

