
|
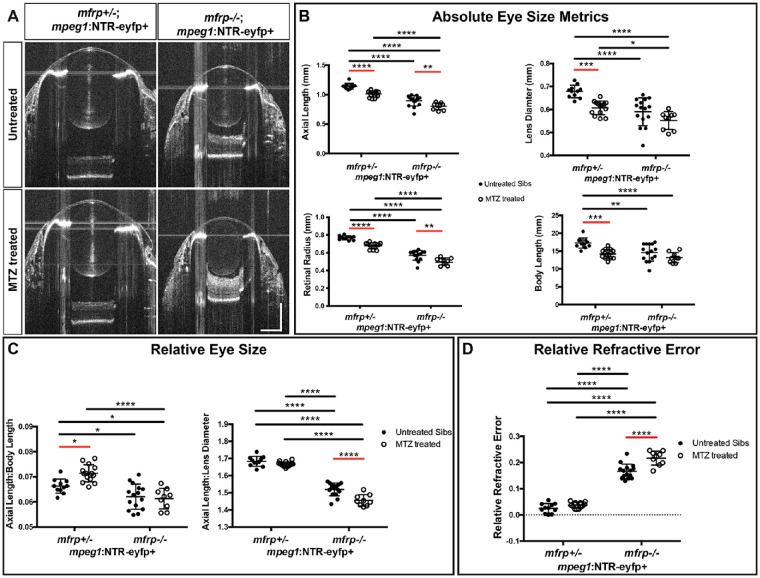
Fig. 4
Macrophage ablation exacerbated hyperopia in mfrp?/? zebrafish. (A) Representative SD-OCT B-scans from the center of mfrp+/?; mpeg1:NTR-eYFP+ eyes and their mfrp?/?; mpeg1:NTR-eYFP+ siblings with or without MTZ treatment. (B) Eye size metrics of mfrp+/?; mpeg1:NTR-eYFP+ and mfrp?/?; mpeg1:NTR-eYFP+ fish with or without MTZ treatment. (C) Axial length normalized to body length and lens diameter. (D) Relative refractive error. Two-way ANOVA was used for statistical analysis. P values are shown from Tukey's multiple comparisons for post hoc analysis. Error bars represent standard deviation. Red bars indicate statistical significance due to MTZ treatment. *P < 0.05, **P < 0.01, ***P < 0.001, ****P < 0.0001. For mfrp+/? untreated, n = 11; for mfrp+/? MTZ treated, n = 14; for mfrp?/? untreated, n = 15; for mfrp?/? MTZ treated, n = 9.