Fig. 3
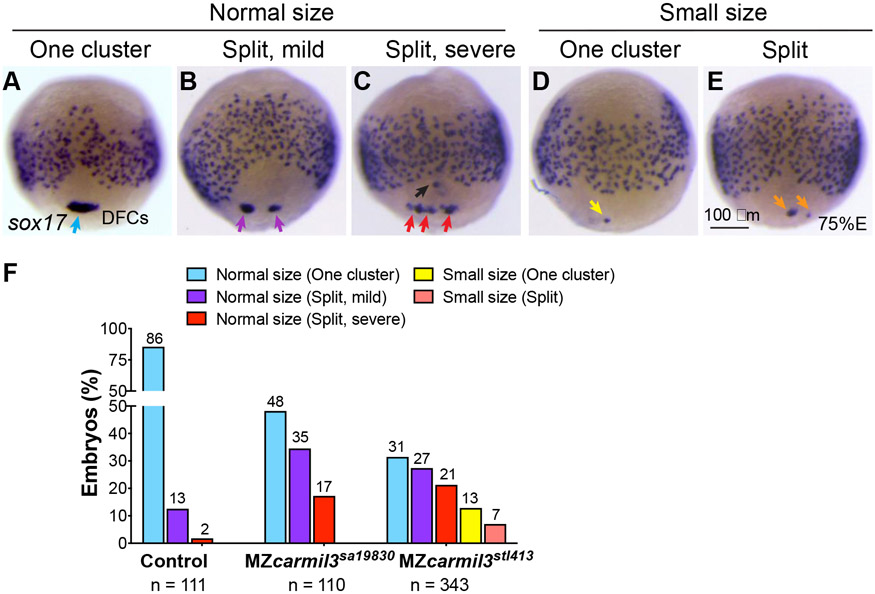
Patterns of dorsal forerunner cell (DFC) distribution in MZcarmil3sa19830 mutant embryos compared to control heterozygous MZcarmil3sa19830/+ embryos. Panels A to E illustrate the patterns observed, with results quantified in panel F. In most control embryos, DFCs form a single tight cluster of normal size (light blue arrow in panel A and light blue bars in panel F). In some embryos, DFCs display three patterns of defects: B) normal size with mild splitting (i.e., two clusters); C) normal size with severe splitting (more than two clusters); D) small size with no splitting; E) small size with splitting. (F) Percentages of embryos displaying the patterns of DFC distribution in control gastrulae and both MZcarmil3sa19830 and MZcarmil3stl413 mutants. The percentage of embryos in each group is indicated above each bar, and the total number of embryos in each group (N) is listed underneath the labels on the abscissa.
Reprinted from Developmental Biology, 481, Stark, B.C., Gao, Y., Sepich, D.S., Belk, L., Culver, M.A., Hu, B., Mekel, M., Ferris, W., Shin, J., Solnica-Krezel, L., Lin, F., Cooper, J.A., CARMIL3 is important for cell migration and morphogenesis during early development in zebrafish, 148-159, Copyright (2021) with permission from Elsevier. Full text @ Dev. Biol.

