IMAGE

Figure 2

ID
ZDB-IMAGE-221226-169
Source
Figures for López-Cuevas et al., 2022
Image
Figure Caption

Figure 2

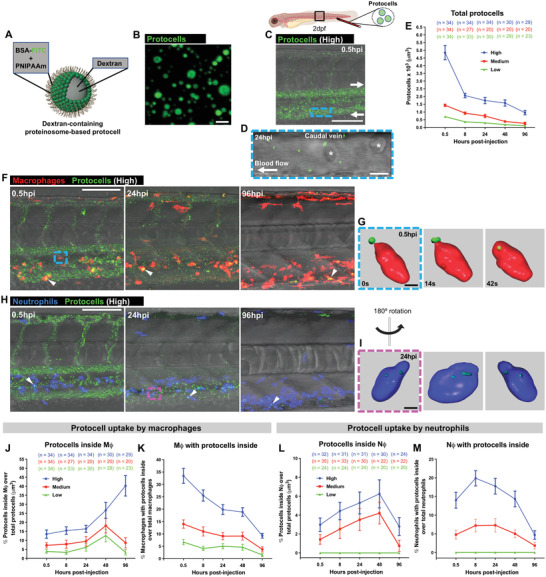
Systemically injected free‐circulating protocells are taken up by leukocytes. A) Schematic representation of dextran‐containing FITC‐labeled proteinosome‐based protocells. B) Single‐channel confocal image of FITC‐protocells. C) Multi‐channel confocal image of the flank of a 2 dpf casper larva after systemic injection of FITC‐protocells at 0.5 hpi; white arrows indicate the direction of the blood flow. D) High magnification view of (C) showing FITC‐protocells moving through the caudal vein at 24 hpi; red blood cells are also imaged (asterisks). See also Figure S3 and Movies S1 and S2, Supporting Information. E) Graph showing quantification of total protocells from the regions imaged in (C). F) Multi‐channel confocal images of the flank of Tg(mpeg1:mCherry) larvae after systemic injection of FITC‐protocells at 2 dpf and imaged at 0.5, 24, and 96 hpi, showing the distribution of protocells within macrophages (white arrowheads) and free within the vasculature. See also Figure S6 and Movies S7 and S8, Supporting Information. G) Imaris 3D reconstruction from confocal movie frames showing a macrophage engulfing and internalizing a free‐circulating FITC‐protocell within the caudal artery (blue dashed box in [F]). See also Movie S3, Supporting Information. H) Multi‐channel confocal images of the flank of Tg(lyz:DsRed) larvae after systemic injection of FITC‐protocells at 2 dpf and imaged at 0.5, 24, and 96 hpi, showing the distribution of protocells within neutrophils (white arrowheads) and free within the vasculature. I) Imaris 3D reconstruction from a confocal z‐stack image showing several FITC‐protocells internalized within a neutrophil at the CHT region (magenta dashed box in [H]). Rendered 3D image is rotated to demonstrate that protocells have been fully taken up by and reside within the neutrophil. See also Movie S4, Supporting Information. J–M) Graphs showing percentage of protocells within macrophages (J) or neutrophils (L), and percentage of macrophages (K) or neutrophils (M) containing protocell(s) quantified from the regions imaged in (F) and (H). See also Figures S4 and S5, and Movies S5 and S6, Supporting Information. “High”, “medium”, and “low” correspond to the different protocell titrations injected (1.25 × 107, 5 × 106, and 2.5 × 106 protocells/µL, respectively). Accompanying schematics illustrate developmental stage (larva), type of injection (systemic), and imaged area (black outlined box) used for the experiments. Data are pooled from three independent experiments. Graphs show mean ± SEM, and each dot represents the mean of all fish analyzed. Mϕ = macrophages; n = number of fish; Nϕ = neutrophils. Scale bars = 2 µm (B), 100 µm (C,F,H), 10 µm (D), 5 µm (G,I).

Acknowledgments
This image is the copyrighted work of the attributed author or publisher, and ZFIN has permission only to display this image to its users. Additional permissions should be obtained from the applicable author or publisher of the image. Full text @ Adv Sci (Weinh)