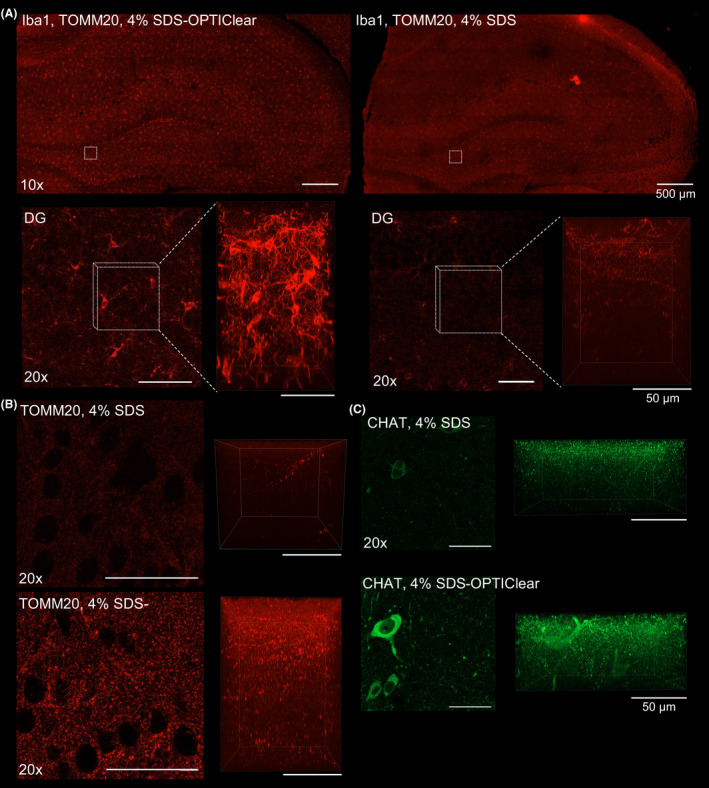
Fig. 3
Comparison between 3D immunostaining of tissue cleared with SDS and SDS?OPTIClear. (A) Iba?1 staining of tissues cleared with 4% SDS?OPTIClear (left panel) and 4% SDS only (right panel). Upper panel: images taken with a 10× objective. Lower panel: zoomed?in image of the dentate gyrus (DG) taken with a 20× objective (left image), Z?stack images taken with a 63× objective with z?depth = 161.7 ?m (right image). (B) TOMM?20 staining of regions cleared with 4% SDS?OPTIClear (left panel) and 4% SDS only (right panel). Left image: 20× images of DG regions. Right image: z?stack of the images showed on the left (z?depth = 125.84 ?m). (C) ChAT staining taken with a 20× objective. Left panel: 20× images of the nbM cleared with 4% SDS and 4% SDS?OPTIClear. Right panel: z?stack of the images showed in the left panel (z?depth = 72 ?m). The same imaging and display settings were used for both 4% SDS and 4% SDS with OPTIClear conditions

