
|
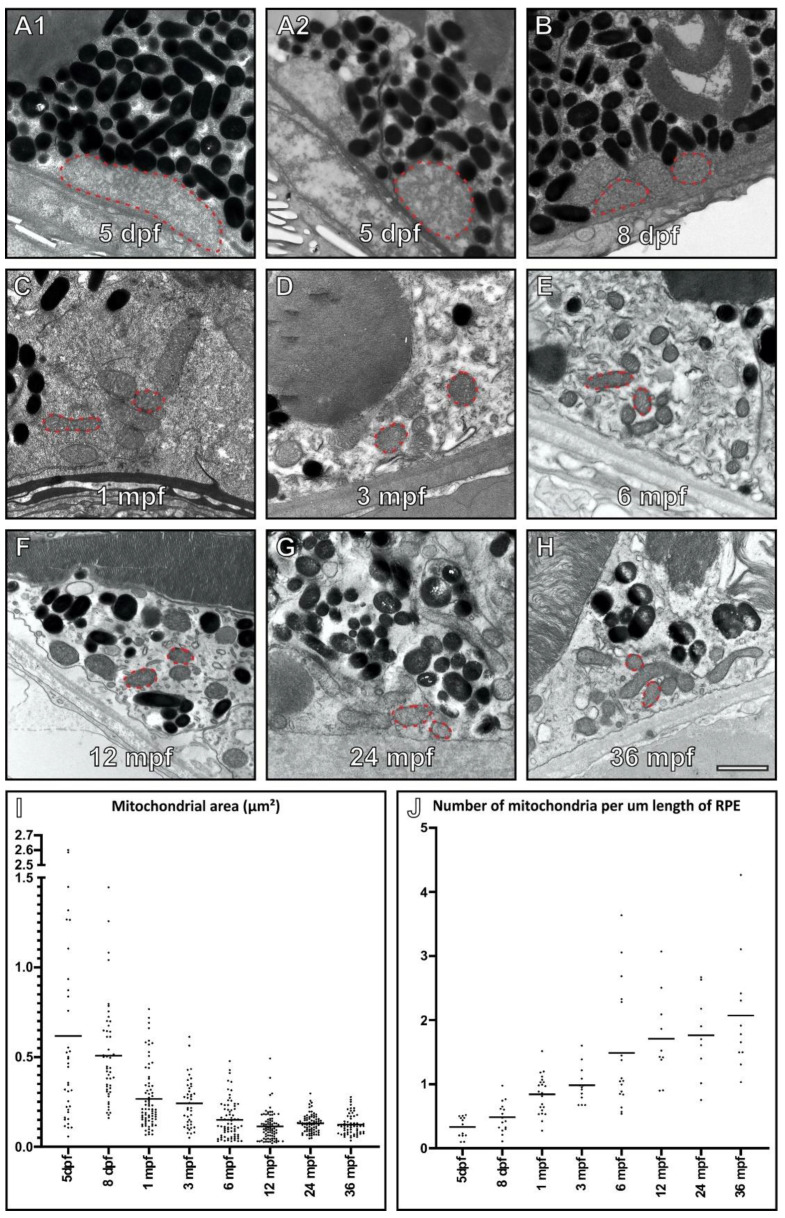
Figure 1
Mitochondria increase in number and decrease in size within the retinal pigment epithelium (RPE) of ageing zebrafish retina. (A?H) Electron microscopy images of mitochondria within zebrafish RPE at 5 dpf through to 36 mpf. The red dotted lines indicate examples of mitochondria within the RPE at each timepoint. All mitochondria were measured in random areas of RPE. When individual mitochondria are examined within the RPE, they (I) decrease in size and (J) increase in number as the zebrafish age. (I,J) At each timepoint, n = 3 zebrafish were examined, and measurements taken from (I) ? 34 mitochondria per age group and (J) ? 8 regions of the RPE. Statistical significance determined by one way-ANOVA (I?J) with p < 0.0001. Scale (A?G) 1 ?m.