
|
Fig. 5
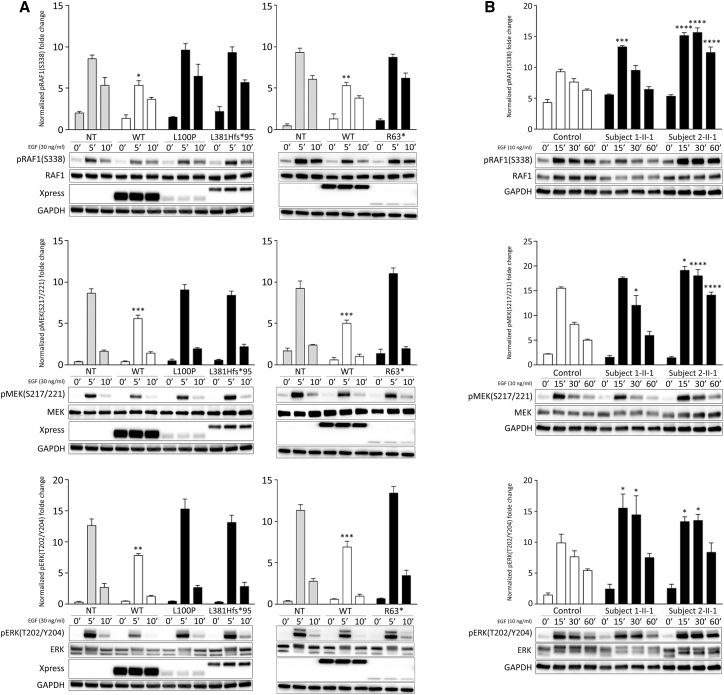
Impact of SPRED2 mutations on MAPK signaling
(A) Overexpression of the RASopathy-causing SPRED2Arg63∗ (R63∗), SPRED2Leu100Pro (L100P), and SPRED2Leu381Hisfs∗95 (L381Hfs∗95) proteins in HEK293T cells do not significantly perturb RAF1, MEK, and ERK phosphorylation as assessed by time-course experiments. Of note, expression of WT SPRED2 down-modulates ERK phosphorylation. HEK293T cells were transiently transfected with the indicated Xpress-tagged SPRED2 constructs, serum-starved and treated with 30 ng/mL EGF for 5 or 10 min, or left unstimulated. Equal amounts of cell lysates were resolved on 10% polyacrylamide gel. Representative blots (below) and mean ± SD densitometry values (above) of three independent experiments are shown. Asterisks indicate statistically significant differences compared with control cells (NT, mock transfection) at the corresponding time upon EGF stimulation (∗p < 0.05; ∗∗p < 0.005; ∗∗∗p < 0.001; two-way ANOVA followed by Tukey’s multiple comparison test).
(B) Primary fibroblasts from subjects 1-II-1 (p.Leu381Hisfs∗95) and 2-II-1 (p.Leu100Pro) show variably enhanced RAF1, MEK, and ERK phosphorylation levels compared to control cells. Fibroblasts were starved for 16 h and then stimulated with EGF (10 ng/mL), in time-course experiments, or left unstimulated. Equal amounts of cell lysates were resolved on 10% polyacrylamide gel. Representative blots (below) and graphs reporting mean ± SD densitometry values (above) of three independent experiments are shown. Asterisks indicate statistically significant differences in the phosphorylation levels compared to control cells at the corresponding experimental points (∗p < 0.05; ∗∗∗p < 0.001; ∗∗∗∗p < 0.0001; two-way ANOVA followed by Tukey’s multiple comparison test).