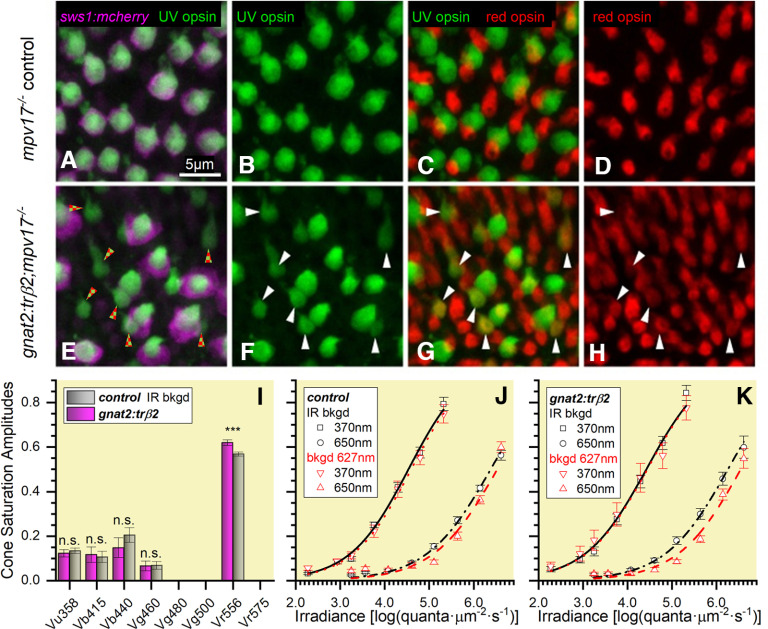
Figure 11.
The UV-opsin reporter is inactive in embryonic cones co-expressing UV and red opsins, but these red opsins produce no UV-desensitizing signal. A, UV-opsin (SWS1) immunoreactivity (green) and florescence of a reporter transgene for sws1 (sws1:nfsBmCherry, magenta) colocalize in mpv17?/? control UV cones. B, UV-opsin immunoreactivity in control retina. C, In the control retina UV-opsin (green) and red-opsin (red) immunoreactivity localize in separate cones. D, Red-opsin immunoreactivity in the control retina. E, In gnat2:tr?2 cones, UV-opsin immunoreactivity (green) is always found when there is sws1 reporter gene fluorescence (sws1:nfsBmCherry, magenta), but not all UV-opsin immunoreactive cones show reporter-gene fluorescence (red and green checkered arrowheads). F, UV-opsin immunoreactive cones in the gnat2:tr?2 retina. G, Co-expression of UV-opsin (green) and red-opsin (red) immunoreactivity in gnat2:tr?2 cones. White arrowheads (F, G, H) point to cones expressing both UV opsin (green) and red opsin (red). The dual opsin cones are the UV-opsin immunoreactive cones in E, that lack sws1 reporter fluorescence (red and green checkered arrowheads). H, Red-opsin immunoreactive cones in gnat2:tr?2 retina. I, Saturation amplitudes (Vmi ± SE) of signals from five cone types in control (gray) and gnat2:tr?2 (magenta) eyes. Control: Spectral algorithm fit to 1890 datapoints from 27 datasets recorded in 15 eyes; gnat2:tr?2, 1260 datapoints from 18 datasets recorded in 11 eyes. In each case, the optimal fit was model 79. Asterisks give significance of differences (two sample t tests, n.s., not significant) in cone-signal amplitudes (Vu358: t(3091) = 0.56, p = 0.57; Vb415: t(3091) = 0.25, p = 0.81; Vb440: t(3091) = 1.05, p = 0.29; Vg460: t(3091) = 0.084, p = 0.93; Vr556, t(3091) = 3.39, p = 0.0007). J, Control strain (mpv17?/?) irradiance-response curves at 370 and 650 nm in the presence of infrared (IR; black) or 627-nm (red) backgrounds (bkgd). Points are means ± SE (370-nm stimulus: IR background, n = 27; red background, n = 15; 650-nm stimulus: IR background, n = 54 or 27; red background, n = 30 or 15). K, gnat2:tr?2 irradiance-response curves at 370 and 650 nm in the presence of IR (black) or red backgrounds. Points are means ± SE (370-nm stimulus: IR background, n = 18; red background, n = 12; 650-nm stimulus: IR background, n = 18 or 36; red background, n = 12 or 24). J, K, Hill function curves fit at each background and wavelength are constrained to have equal maximal amplitudes and exponents. Cone-PIII ERG signals isolated with 20 mm aspartate. A?K, Eyes and retinas are from 5-dpf embryos.

