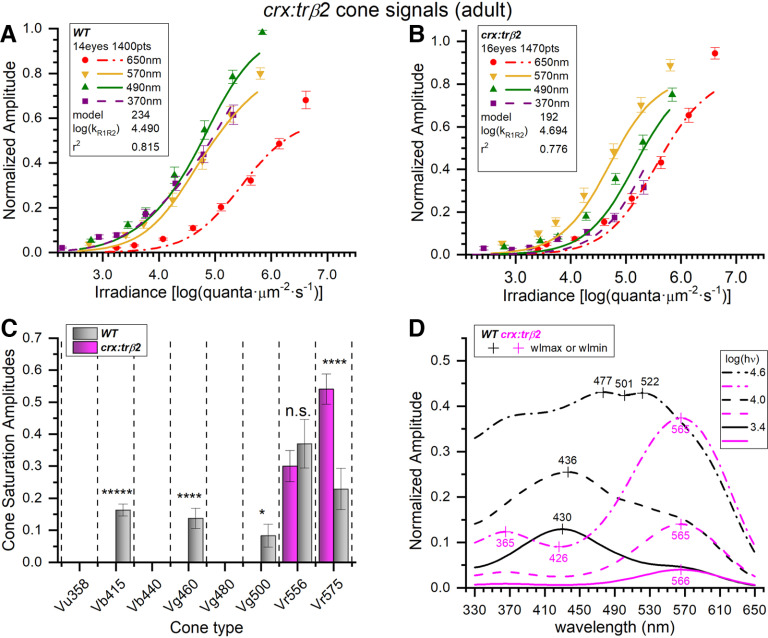
Figure 6.
Adult crx:mYFP-2A-tr?2 transgenics are red-cone dichromats. A, Wild-type cone-PIII irradiance-response curves and datapoints at four stimulus wavelengths. The 370-, 490-, 570-, and 650-nm amplitudes are means (ħSE) from the cumulative dataset (n = 20 except at 650 nm where n = 20 or 40). Curves are generated from the optimal model (#234) fit to a cumulative 1400 responses at seven irradiances for each of nine wavelengths as compiled from 20 spectral datasets acquired in 14 WT adult eyecups. B, The crx:tr?2 gain-of-function transgene causes irradiance-response points and model curves to bunch together as compared with WT. The model generating the curves (#192) is fit to 1470 cumulative responses compiled from 21 datasets acquired from 16 crx:tr?2 eyecups. The amplitudes (ħSE) are means (370, 490, 570, and 650 nm, n = 21 except for 650 nm, n = 21 or 42). C, Signals from five blue, green, or red cone types were detected in WT adults (gray bars), but signals from only the two red-cone types were detected in crx:tr?2 eyecups (magenta bars). Fit values of cone saturation amplitudes (Vmi, Eq. 1; Fig. 2A) are plotted on a dataset-normalized scale (ħSE). Except for Vr556 (LWS2) cone types differed significantly in amplitudes between WT and crx:tr?2 (asterisks, GraphPad Prism convention, n.s., not significant). Vb415 (B1, one-sample test): t(1373) = 8.77, p = 5.4 × 10?18; Vg460 (G1, one-sample test): t(1373) = 4.36, p = 1.4 × 10?5; Vg500 (G3, one-sample test): t(1373) = 2.30, p = 0.021; Vr556(R2): t(2818) = 0.782, p = 0.434; Vr575 (R1): t(2818) = 3.91, p = 9.2 × 10?5. D, Model spectral curves for adult WT (black) and crx:tr?2 (magenta) eyecups. The crx:tr?2 transgene shifts sensitivity peaks to long wavelengths at all stimulus irradiances. Curves are modeled for constant quantal stimuli at 3.4, 4.0, and 4.6 log(quanta·?m?2·s?1). A, B, The log(kR1R2) values are the irradiance semi-saturation values in log(quanta·?m?2·s?1) for both R1 and R2 cones. A?D, Eight- to 18-month adults, 10 mm aspartate medium.

