
|
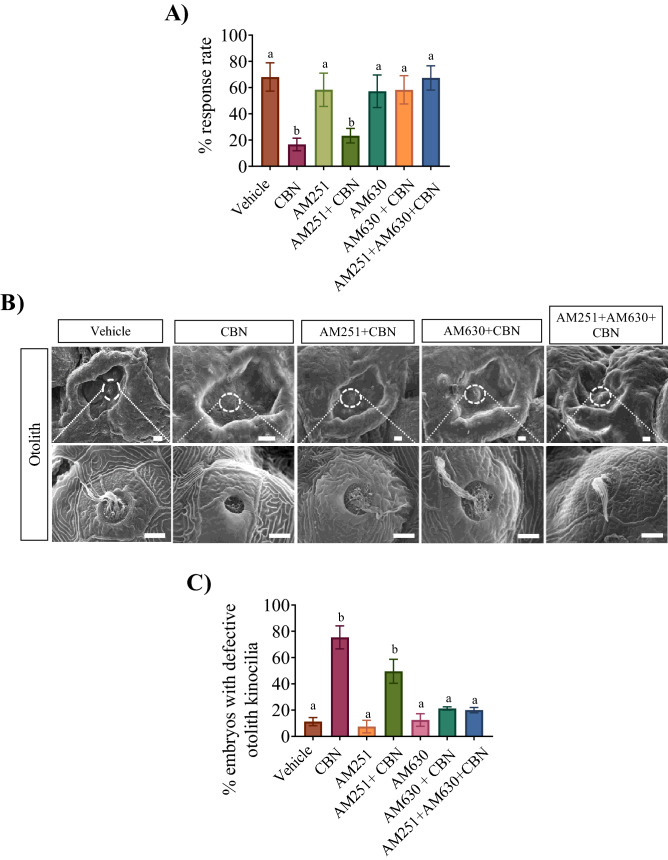
Figure 6 Blocking Cb1r and Cb2r prevents the CBN-induced changes in otolith hair cell development. (A) Bar graph shows the mean percentage of animals that responded to sound/vibration stimulus in the presence or absence of receptor blockers and CBN in 5 dpf larvae. The response to sound stimuli (C-bend) was recorded following exposure to sound and analyzed later for calculating response rate (%). N = 3 experiments. (B) SEM images were taken of the head i.e. anterior lateral line (aLL). (B) Images were taken at �500 magnification for 3 mg L?1 CBN (n = 5), AM251 10 nm + 3 mg L?1 CBN (n = 5), AM630 10 �m + 3 mg L?1 CBN (n = 5) and AM251 10 nm + AM630 10 �m + 3 mg L?1 CBN (n = 5) respectively. Scale bar represents 20 �m. (C) Bar graph showing the quantification of the percentage of the embryos that exhibited deformities in the kinocilia associated with the otoliths. Groups which share the same letter(s) of the alphabet are not statistically different from one another; p < 0.05.