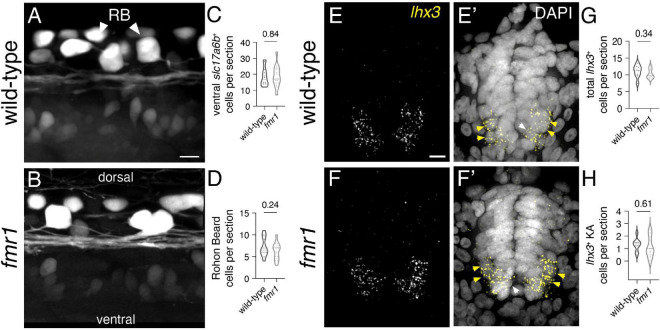
FIGURE 3 Fmrp does not regulate glutamatergic cell production. Representative lateral images of the spinal cord of live wild-type (A) and fmr1 mutant (B) embryos expressing slc17a6b:LoxP-DsRed-LoxP-EGFP, a glutamatergic neuron reporter, at 24 hpf. Quantification of slc17a6b+ cells in the ventral spinal cord [(C); two-tailed t-test], and slc17a6b+ Rohon?Beard (RB) cells in the dorsal cord [(D); two-tailed t-test]. RBs have large cell bodies and brightly express the reporter [arrowheads, (B)]. Representative images of fluorescent in situ hybridization (FISH) experiments to detect lhx3 expression in transverse trunk spinal cord sections of wildtype (E) and fmr1 (F) embryos at 24 hpf. Presumptive lhx3+ V2a interneurons (INs) in the lateral region are indicated with yellow arrowheads and lhx3+ KA neurons adjacent the central canal are labeled by white arrowheads (E?,F?,E?,F?). Quantification of total lhx3+ cells [excluding KA; (G); two-tailed t-test] and lhx3+ KA cells per section [(H); two-tailed t-test]. lhx3 quantification reflects the average number of cells per section, averaged by embryo. Scale bars = 10 ?m. P-values indicated in graphs, where p < 0.05 is considered significant. See also Supplementary Figure 3.
Image
Figure Caption
Figure Data
Acknowledgments
This image is the copyrighted work of the attributed author or publisher, and
ZFIN has permission only to display this image to its users.
Additional permissions should be obtained from the applicable author or publisher of the image.
Full text @ Front. Neurosci.

