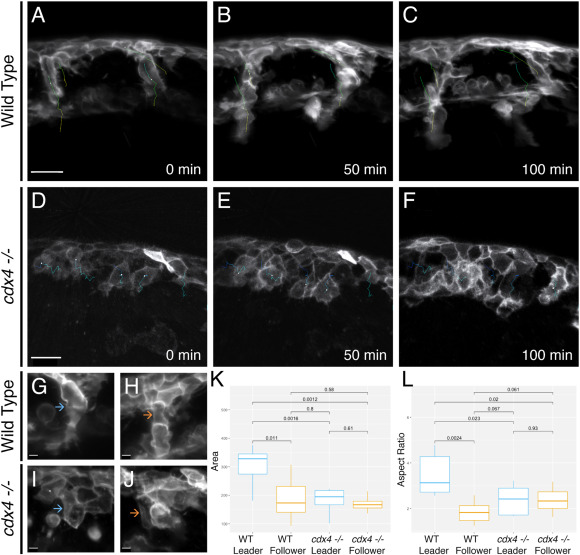
Fig. 5 cdx4 mutants exhibit aberrant cell behaviors during migration. A-J. Timelapse microscopy of trunk NC cell migration in Tg(sox10:mRFP) embryos visualized by SPIM reveals cellular behaviors. A-C. In WT embryos, NC cells migrate as single-cell segmental chains. Tracking of leader and follower cells during migration shows that leader cells are not overtaken. Scale bar ?= ?25 ??m. D-F. In cdx4ch107?/- embryos tracking of NC cells shows that the first cells to migrate are overtaken by later-migrating cells. Scale bar ?= ?25 ??m. G, H. High magnification view in a WT specimen of the leader cell (G) (blue arrow) and follower cell (H) (orange arrow). Scale bar ?= ?5 ??m. I, J. High magnification view in a cdx4ch107?/- mutant specimen of the first cell to migrate (I) (blue arrow) and a later-migrating cell (J) (orange arrow). Scale bar ?= ?5 ??m. K, L. Box plots of the area (K, units ?= ??m2) and aspect ratio (L) of migrating NC cells in WT and cdx4ch107?/- embryos.
Reprinted from Developmental Biology, 480, Rocha, M., Kushkowski, E., Schnirman, R., Booth, C., Singh, N., Beadell, A., Prince, V.E., Zebrafish Cdx4 regulates neural crest cell specification and migratory behaviors in the posterior body, 25-38, Copyright (2021) with permission from Elsevier. Full text @ Dev. Biol.

