
|
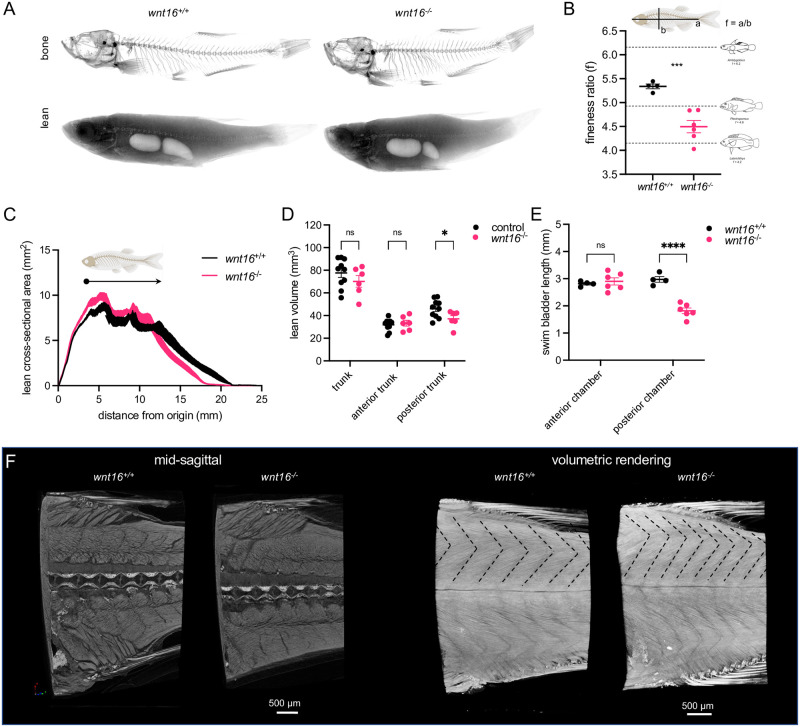
Fig 8
(A) Segmentation of microCT images for bone (top) and lean (bottom) tissue. Shown are average intensity projections. (B) wnt16-/- mutants exhibit reduced fineness ratio. Fish images adapted from [46]. (C) Lean cross-sectional area as a function of distance along the anteroposterior axis. Thickness of the line indicates standard error of the mean (n = 4-6/group). Arrowhead indicates approximate boundary between the anterior and posterior swim bladders. (D) Lean volume in the trunk, anterior trunk, and posterior trunk. wnt16-/- mutants exhibit reduced lean volume in the posterior trunk compared to controls (wnt16+/+ and wnt16+/-) (E) wnt16-/- mutants exhibit reduced swim bladder length in the posterior, but not anterior, chamber compared to wildtype. (F) High-resolution contrast-enhanced microCT reveals altered myomere width and angle in wnt16-/- mutants as indicated by dotted lines in the top part of the myotome compartment in volumetric renderings. P-values were determined using an unpaired t-test (B) or two-way repeated measures ANOVA (D and E) with Fisher’s LSD post hoc test. *p<0.05, ***p<0.001, ****p<0.0001. Fig 8 adapts portions of Fig 1 from the following paper: Walker, J.A., Alfaro, M.E., Noble, M.M., and Fulton, C.J. (2013). Body fineness ratio as a predictor of maximum prolonged-swimming speed in coral reef fish. PLoS One 8, e75422. The paper of Walker et al., which was published in PLoS One, applies the Creative Commons Attribution 4.0 International (CC BY) license (https://journals.plos.org/plosone/s/licenses-and-copyright).