IMAGE

Figure S3.

ID
ZDB-IMAGE-221118-17
Source
Figures for Hayot et al., 2022
Image
Figure Caption

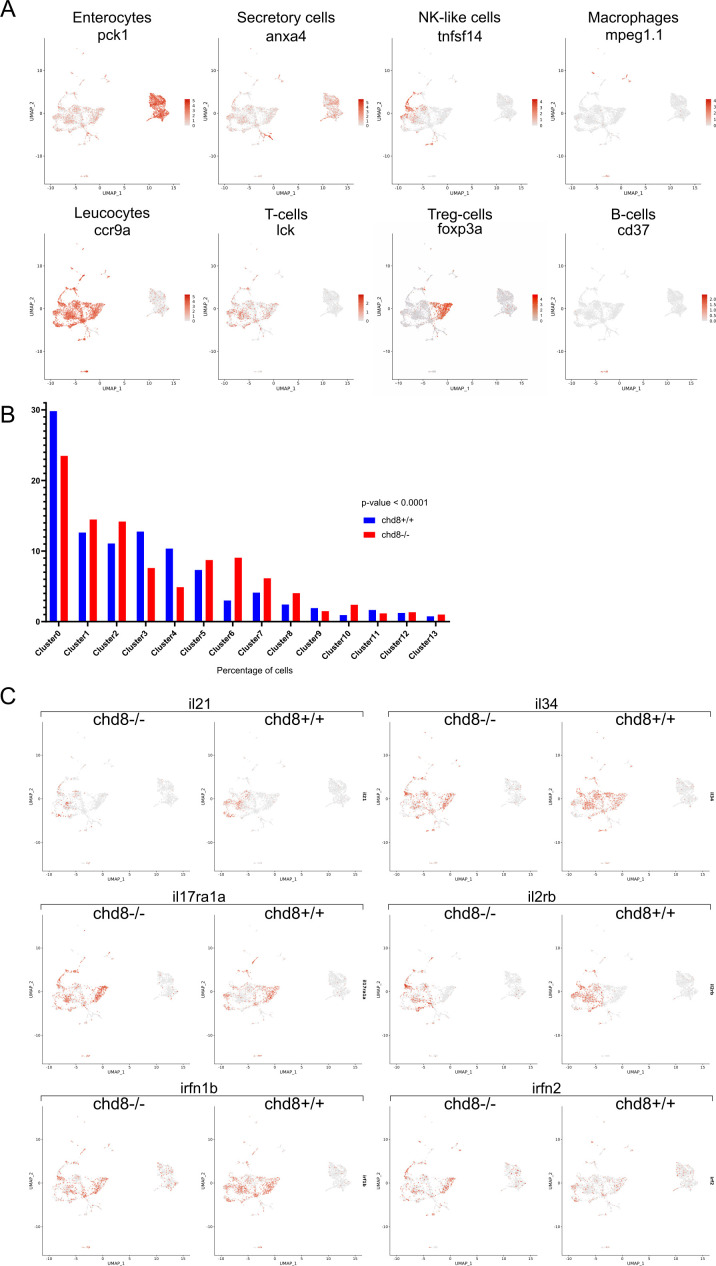
Figure S3. Expression levels of cell-type markers and interleukins.

(A) UMAP. The color shows the level of the expression of pck1, anxa4, tnfsf14, mpeg1.1, ccr9a, lck, foxp3a, and cd37, markers of enterocytes, secretory cells, NK-like cells, macrophages, leukocytes, T cells, Treg cells, and B cells, respectively. (B) Repartition of cells in the clusters. Fisher’s exact test was conducted between pairs of conditions. (C) UMAP. The color shows the level of the expression of il21, il34, il17ra1a, il2rb, irfn1b, and irfn2.

Acknowledgments
This image is the copyrighted work of the attributed author or publisher, and ZFIN has permission only to display this image to its users. Additional permissions should be obtained from the applicable author or publisher of the image. Full text @ Life Sci Alliance