Image
Figure Caption
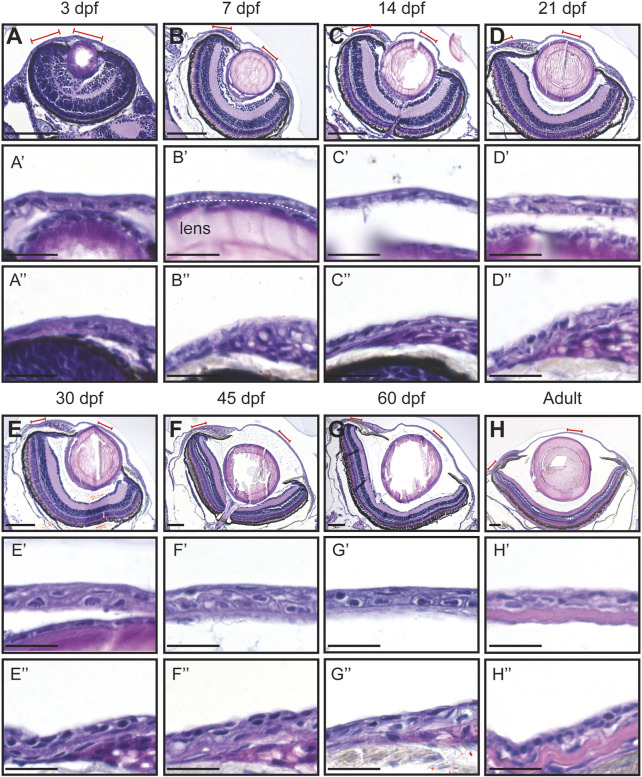
FIGURE 2 Hematoxylin-eosin staining of the eye in fish of different age (dpf, days post-fertilization). (A?H) Coronal sections of the eye, anterior side on the right. Red lines indicate the regions presented in higher-magnification images. White dashed line in (B?) indicates the border between the lens and the cornea. (A??H?) Cornea in the central region. (A???H??) Cornea in the periphery/limbus. 3 samples per age group were checked. Scale bars: 100 Ám in (A?H), 20 Ám in (A??H??).
Acknowledgments
This image is the copyrighted work of the attributed author or publisher, and
ZFIN has permission only to display this image to its users.
Additional permissions should be obtained from the applicable author or publisher of the image.
Full text @ Front. Physiol.

