
|
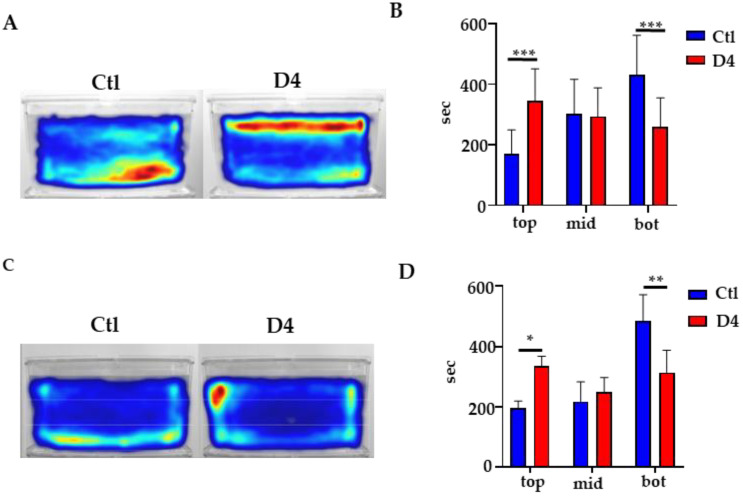
Figure 7
Behavioral analysis in adult fish. (A) Heat map visualization of the cumulative track of 1-year-old fish obtained with Noldus EthoVision software. (B) Quantification of the time spent in the top (top), middle (mid), and bottom (bot) part of the tank by 1-year-old fish; N = 11 for Ctl and 12 for D4 *** p < 0.001, ANOVA with Sidak’s correction for multiple comparisons. (C) Heat map visualization of the cumulative track of 3-month-old fish obtained with Noldus EthoVision software. (D) Quantification of the time spent in different sections of the tank (top, mid, and bot) by 3-month-old fish; N = 3, * p < 0.05, ** p < 0.01, ANOVA with Sidak’s correction for multiple comparisons.