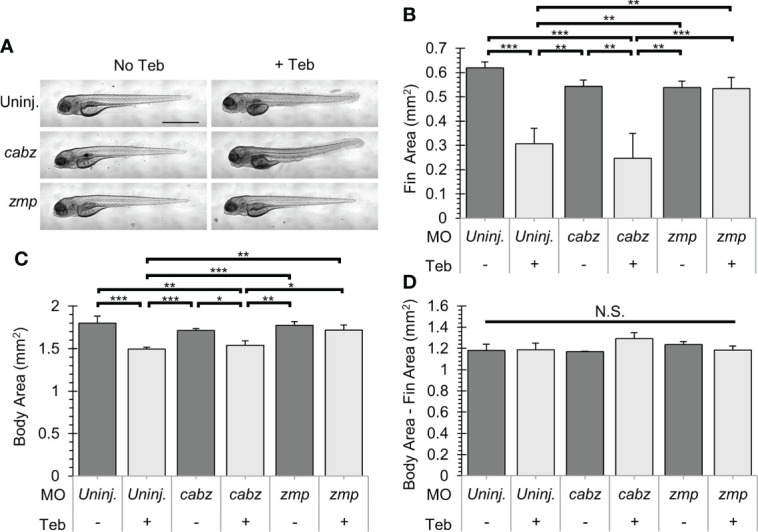
Figure 5
Gross morphological analysis of Il-1?-induced morbidity. (A) Representative images of ubb:Gal4-EcR, uas:Il?mat larvae showing gross morphology. Shown here are uninjected larvae, cabz morphants, and zmp morphants without Teb (No Teb) and with Teb treatment (+Teb). Note that zmp morphants +Teb showed normal morphology with no gross defects. (B?D) Mean Cross-Sectional Fin Area (B), Body Area (C), and the product of Body Area ? Fin Area (D) was plotted in mm2 for each group. Error Bars are +1 standard deviation. Asterisks indicate significant differences *p < 0.05 **p < 0.01 ***p < 0.001; N.S., not significant; by one-way ANOVA followed by Tukey?s HSD Test. Scale bar in (A) is 1 mm.

