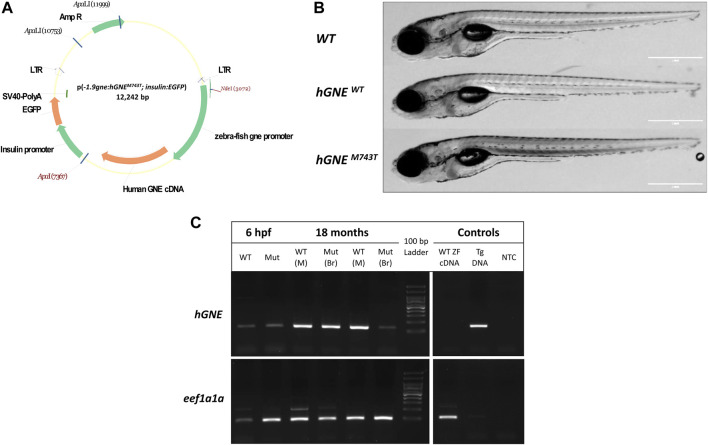
FIGURE 1 Generation of hGNEM743T/WT transgenic lines. (A) A schematic representation of the p(-1.9gne:hGNEM743T/WT; insulin:EGFP) plasmid. Genes, promoters, LTRs, polyadenylation signal and restriction sites are indicated. (B) The hGNE transgenic lines develop normally. The figure presents brightfield images of a WT (top), hGNEWT transgenic (middle), and hGNEM743T transgenic (bottom) larvae at 8 dpf. Scale bar = 1 mm. (C) RT-PCR analysis of hGNE mRNA expression in hGNEM743T and hGNEWT transgenic lines. Agarose gel electrophoresis of RT-PCR amplification products of the hGNE gene (top) and eef1a1a (bottom) as the internal control. Both the hGNEM743T (Mut) and hGNEWT (WT) cDNA samples show the expected amplification in all tested time points and tissues. Non-transgenic WT zebrafish cDNA (WT ZF cDNA) and genomic DNA from transgenic fish (Tg DNA) served as controls for each target. (NTC) no template control, (M) Muscle, (Br) Brain tissue.
Image
Figure Caption
Figure Data
Acknowledgments
This image is the copyrighted work of the attributed author or publisher, and
ZFIN has permission only to display this image to its users.
Additional permissions should be obtained from the applicable author or publisher of the image.
Full text @ Front Cell Dev Biol

