
Image
|
Figure Caption
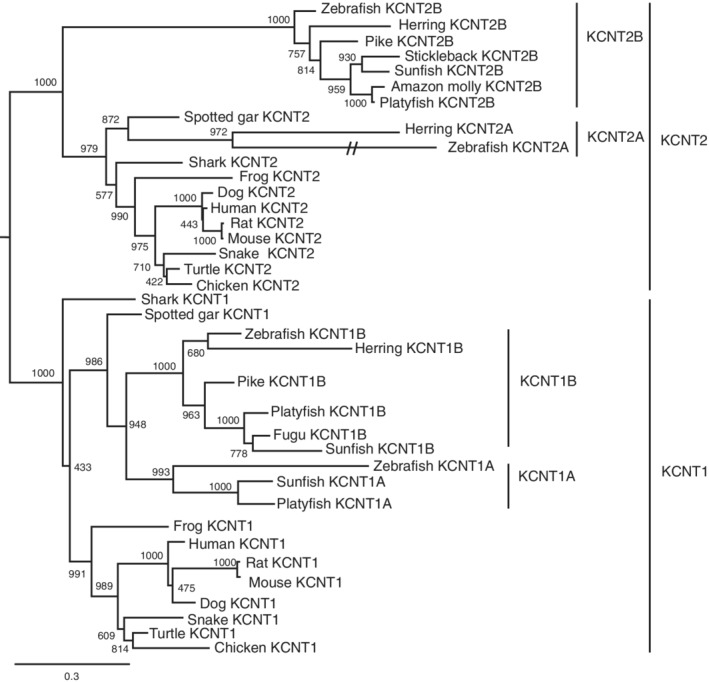
Fig. 8
Maximum likelihood phylogenetic analysis of vertebrate KCNT proteins. Molecular phylogenetic tree generated using ML analysis on vertebrate KCNT proteins as obtained with JTT model plus gamma distribution. Numbers at each node denote bootstrap values based on 1000 replicates. Branch lengths are proportional to expected replacements per site. Each protein forms a distinct clade. The dashed lines indicate a long‐branch of the zebrafish Kcnt2a. Teleost species possess both Kcnt1 and Kcnt2 proteins
Acknowledgments
This image is the copyrighted work of the attributed author or publisher, and
ZFIN has permission only to display this image to its users.
Additional permissions should be obtained from the applicable author or publisher of the image.
Full text @ Dev. Dyn.