
Image
|
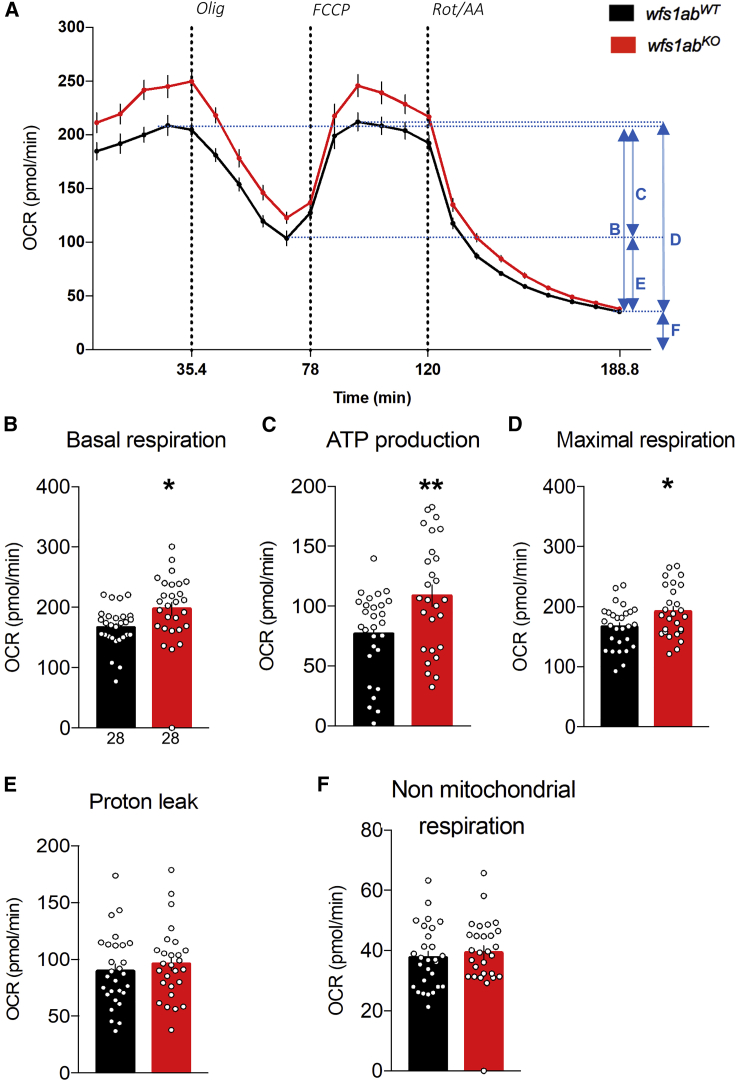
Figure Caption
Figure 4
Analysis of mitochondrial respiration in 5 dpf wfs1KO zebrafish larvae
(A) Oxygen consumption rate (OCR) profiles of wfs1abWT and wfs1abKO zebrafish larvae at 5 dpf during the assay and calculated, (B) basal respiration rate, (C) ATP production-related OCR, (D) maximal respiration, (E) proton leak, and (F) non-mitochondrial respiration. Data are mean from triplicates and show mean � SEM from n = 28 animals per genotype. Olig, oligomycin; FCCP, cyanide-p-trifluoromethoxyphenylhydrazone; Rot/AA, rotenone + antimycin A. ?p < 0.05, ??p < 0.01 versus wfs1abWT, unpaired t test.
Figure Data
Acknowledgments
This image is the copyrighted work of the attributed author or publisher, and
ZFIN has permission only to display this image to its users.
Additional permissions should be obtained from the applicable author or publisher of the image.
Full text @ Mol Ther Methods Clin Dev