Figure 2
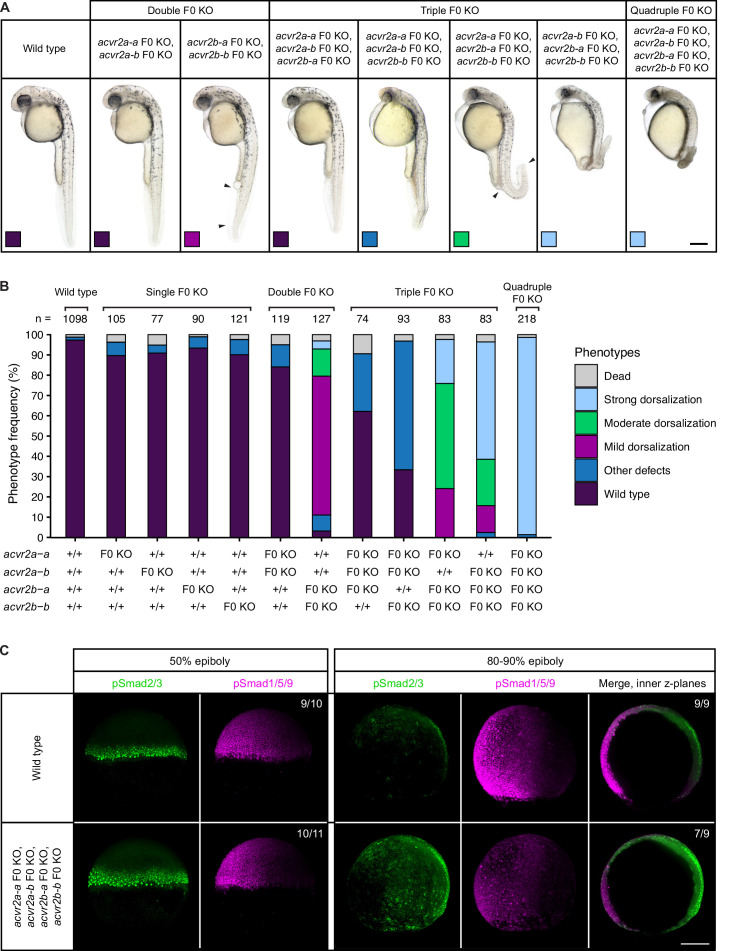
(A?B) Phenotypes of embryos upon single, double, triple, and quadruple CRISPR F0 KO of acvr2 receptors. (A) Lateral view of embryos of the indicated condition approximately 28?31 hpf. Arrowheads indicate the extent of ventral fin loss. Boxes indicate the phenotype class according to the scheme presented in (B). Scale bar represents 250 Ám. (B) Frequency of phenotypes observed in embryos of the indicated condition at 1 dpf. n indicates the number of analyzed embryos. (C) Nodal and BMP signaling visualized by pSmad2/3 and pSmad1/5/9 immunostaining, respectively, in wild-type and quadruple acvr2 F0 KO embryos at 50% and 80?90% epiboly. Maximum intensity projections show lateral views with dorsal to the right. The number of embryos with the presented phenotype is indicated. Scale bar represents 200 Ám. See the Figure 2?source data 1 file for source data.
Combinatorial removal of putative Type II Nodal receptors causes dorsal-ventral patterning defects.
Image
Figure Caption
Figure Data
Acknowledgments
This image is the copyrighted work of the attributed author or publisher, and
ZFIN has permission only to display this image to its users.
Additional permissions should be obtained from the applicable author or publisher of the image.
Full text @ Elife

