
|
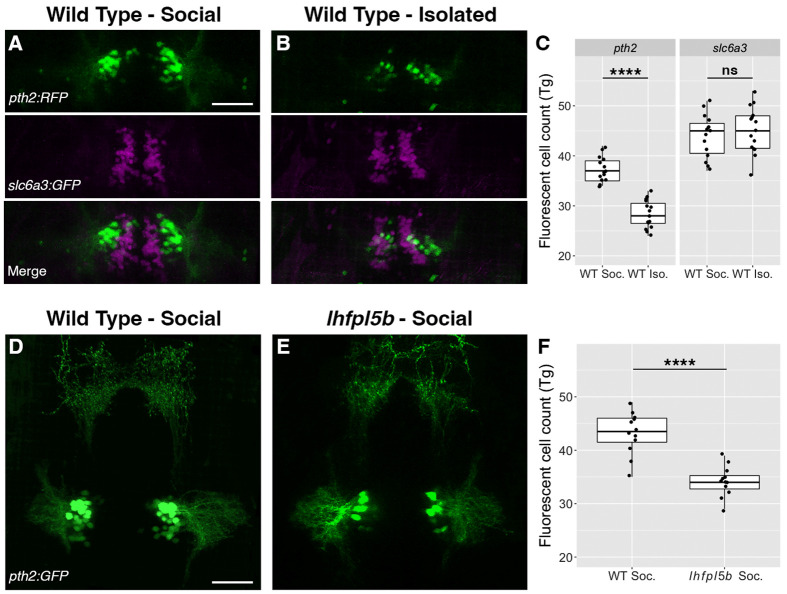
Fig. 5.
The pth2 transgenes respond to social context and lateral line input. (A,B) Representative images of Tg(pth2:TagRFP)unb3 (false-colored green) and Tg(slc6a3:EGFP)ot80 (false-colored magenta) transgenes in (A) socially reared and (B) isolated larvae at 4 dpf. Merges of the two channels show the close proximity of the pth2 and slc6a3-positive cell clusters. (C) Boxplots of pth2 and slc6a3 cell counts (n=15 per condition). (D,E) Representative images of Tg(pth2:EGFP)unb2 transgene expression in socially reared (D) WT and (E) lateral line mutant (lhfpl5bvo35) larvae at 4 dpf. (F) Boxplots of GFP-positive cell counts in WT and lhfpl5b mutant siblings (n=12 per condition). Scale bars: 50 �m. For both experiments, a one-tailed Welch's t-test was used to assess significance, ****P<0.0001; ns, not significant.