
Image
|
Figure Caption
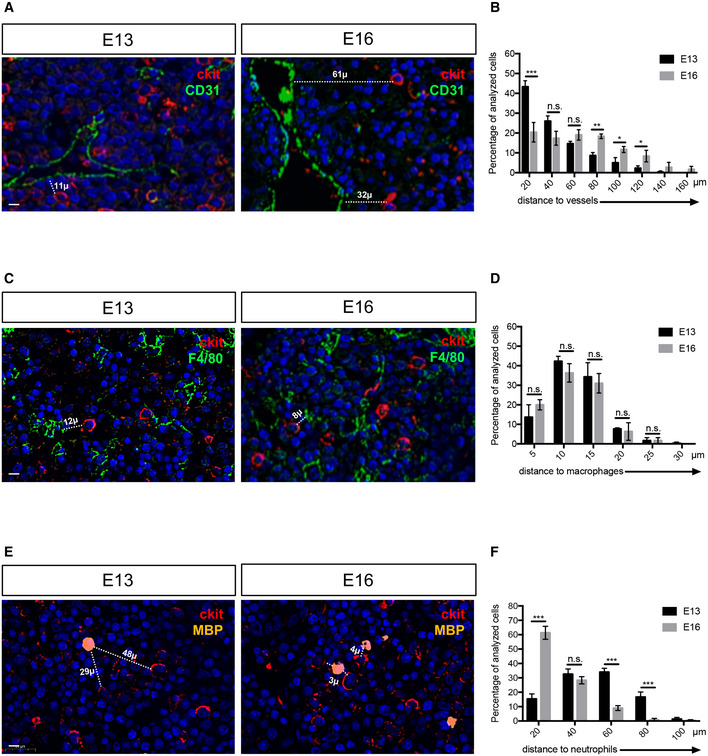
Fig. 8
Myeloid and endothelial cells are very close to HSPCs in the mouse fetal liver
- AImmunohistochemistry on paraffin sections for cKit (HSPCs marker) and CD31 (endothelial cell marker) at E13 and E16 stages of mouse fetal liver.
- BDistance distribution between cKithigh cells and endothelial cells (n = 79 from three E13 fetal livers; n = 92 from three E16 fetal livers), binned into 20 ?m intervals. Statistical analysis was completed using a t?test. *P < 0.01; **P < 0.001; ***P < 0.0001. Center values denote the mean, and error values denote s.e.m.
- CImmunohistochemistry on paraffin sections for cKit (HSPCs marker) and F4/80 (macrophage cell marker) at E13 and E16 stages of mouse fetal liver.
- DDistance distribution between cKithigh cells and macrophages (n = 54 from three E13 fetal livers; n = 64 from three E16 fetal livers), binned into 5 ?m intervals. Statistical analysis was completed using a t?test.
- EImmunohistochemistry on paraffin sections for cKit (HSPCs marker) and MBP (neutrophil cell marker) at E13 and E16 stages of mouse fetal liver.
- FDistance distribution between cKithigh cells and neutrophils (n = 45 from three E13 fetal livers; n = 53 from three E16 fetal livers), binned into 20 ?m intervals. Statistical analysis was completed using a t?test ***P < 0.001.
Data information: All nuclei were marked with DAPI. Scale bar is 20 ?m (A?C?E).
Acknowledgments
This image is the copyrighted work of the attributed author or publisher, and
ZFIN has permission only to display this image to its users.
Additional permissions should be obtained from the applicable author or publisher of the image.
Full text @ EMBO J.