Figure 3
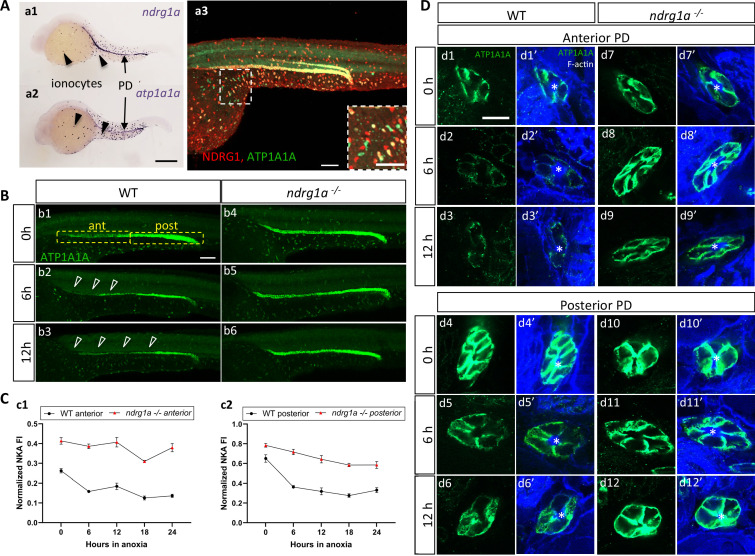
(A) Lateral views of 24 hpf WT embryos revealing (a.1,2) ndrg1a and atp1a1a transcript distribution using whole-mount in situ hybridization. (a.3) Ndrg1a and ATP1A1A protein distribution using double immunolabeling. Scale bars: a1, a2: 300 ?m, a3: 100 ?m for both wholemount and inset. (B) Lateral views of WT embryos and ndrg1a-/- mutants exposed at 24 hpf to increasing duration of anoxia: (b1, b4) 0 hr; (b2, b5) 6 hr; (b3, b6) 12 hr and immunolabeled to reveal ATP1A1A. (n=3 experiments with an average of 29 embryos processed per experiment). Scale bar 100 ?m. Abbreviations: ant = anterior, post = posterior. Annotations: yellow boxes show where anterior and posterior pronephric duct measurements were taken. Arrowheads indicate decreased signal. (C) Normalized fluorescence intensity in the (c1) anterior and (c2) posterior pronephric duct of WT embryos and ndrg1a-/- mutants. Embryos were exposed at 24 hpf to increasing duration of anoxia (0, 6, 12, 18, and 24 hr) and immunolabeled to reveal ATP1A1A levels. (n=3 experiments with an average of 21 pronephros segments processed per experimental group; Figure 3?source data 1). (D) Cross-sections views of the anterior (d1-d3?, d7-d9?) and posterior (d4-d6?, d10-d12?) pronephric ducts in WT embryos (d1-d3?, d4-d6?) and ndrg1a-/- mutants (d7-d9?, d10-d12?), labeled with anti-ATP1A1A and phalloidin (F-actin). (n=3 experiments with an average of 61 pronephric duct cross-sections processed per experimental group). Scale bar 20 ?m. Annotations: asterisks indicate the lumen (apical surface of PD cells).
NKA downregulatation in the pronephric duct in response to anoxia is ndrg1a-dependent.
Image
Figure Caption
Figure Data
Acknowledgments
This image is the copyrighted work of the attributed author or publisher, and
ZFIN has permission only to display this image to its users.
Additional permissions should be obtained from the applicable author or publisher of the image.
Full text @ Elife

