
|
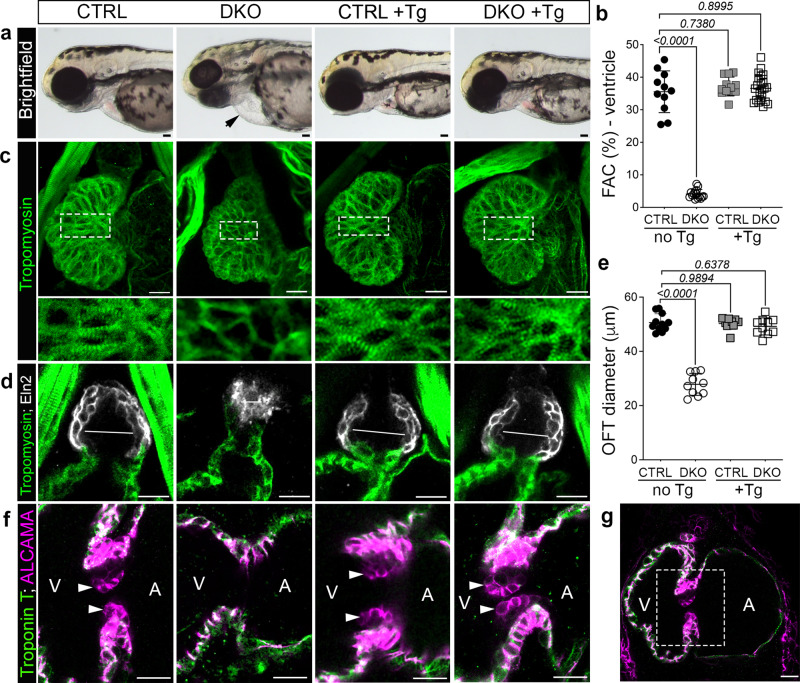
Fig. 6
a Brightfield images of 72 hpf CTRL or DKO embryos in the absence or presence of the Tg(myl7:rbfox1l) transgene (Tg). Black arrow highlights pericardial edema in DKO. b Dot plot showing % fractional area change (FAC) of ventricles in 72 hpf CTRL or DKO embryos in the absence or presence of the Tg(myl7:rbfox1l) transgene. c Confocal projections of hearts in 72 hpf CTRL or DKO embryos in the absence or presence of the Tg(myl7:rbfox1l) transgene following immunostaining for Tropomyosin. Boxed regions are shown below each panel at higher magnification. d Confocal sections of outflow tracts (OFTs) in 72 hpf CTRL or DKO embryos in the absence or presence of the Tg(myl7:rbfox1l) transgene following immunostaining for Tropomyosin (green) and Eln2 (white). White lines depict OFT diameter. e Dot plot showing quantification of OFT diameter. f Confocal sections of the atrioventricular canal in 72 hpf CTRL or DKO embryos in the absence or presence of the Tg(myl7:rbfox1l) transgene after immunostaining for Troponin T (green) and ALCAMA (pink). White arrowheads mark the endocardial cushions that are lacking DKO. g Boxed region approximates the areas shown at higher magnification in f. Sample sizes and Statistics: (a, b) n = 11 CTRL, n = 15 DKO, n = 12 CTRL+ Tg, n = 23 DKO+ Tg; (c) n = 10/cohort; (d, e): n = 11 CTRL, n = 10 DKO, CTRL + Tg, DKO + Tg (f) n = 9 CTRL+ or ? the transgene and n = 6 DKO+ or ? the transgene. Each dot represents 1 embryo in both graphs. Data are presented as mean values +/? one SD. Statistical significance was determined by ordinary one-way ANOVA Dunnet?s multiple comparisons test. P values are shown. Source data are provided as a Source Data file. Scale bars: 20 ?m.