
|
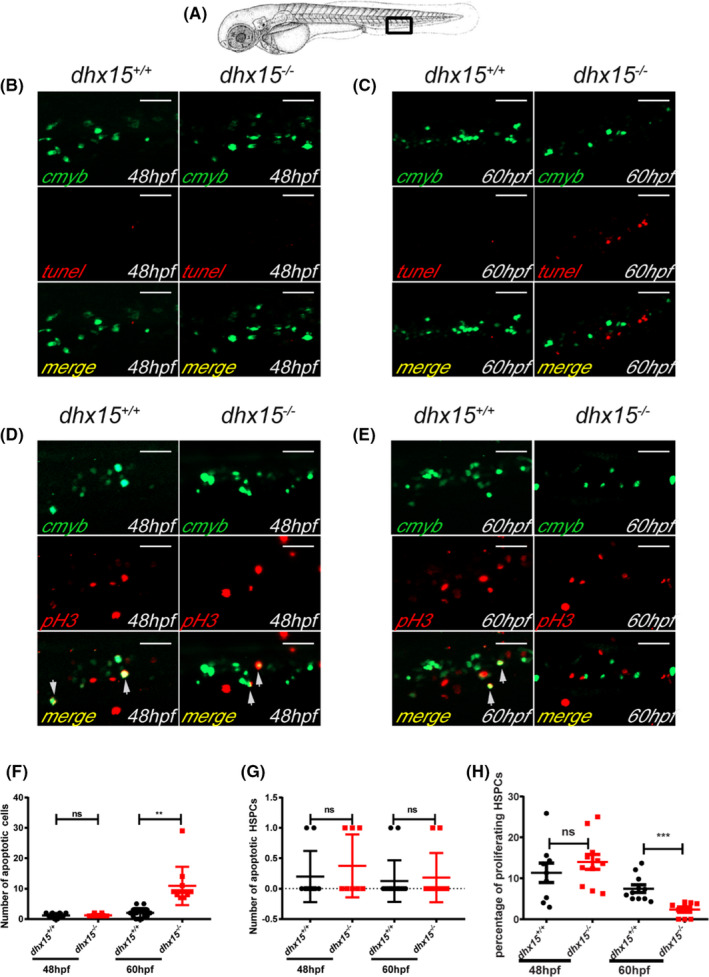
Fig. 3
Abated proliferation but not excessive apoptosis of HSPCs is observed in dhx15?/? zebrafish. A, Schematic indicates the area of the imaging in the tail (CHT), outlined by the black box. B, C, Fluorescence images of the cmyb and apoptotic cells in CHT of dhx15+/+; Tg(cmyb:gfp) and dhx15?/?; Tg(cmyb:gfp) zebrafish embryos at 48 hours post fertilization (hpf) (B) and 60 hpf (C). D, E, Fluorescence images of pH3 and cmyb positive cells in CHT of dhx15+/+; Tg(cmyb:gfp) and dhx15?/?; Tg(cmyb:gfp) zebrafish embryos at 48 hpf (D) and 60 hpf (E). F, Number of apoptotic cells in CHT at 48 hpf (wildtype, 1.2 � 0.2494, n = 10; dhx15?/? embryos, 1.25 � 0.1637, n = 8; P > .05, Student?s t test) and 60 hpf (wildtype, 2.063 � 0.3923, n = 16; dhx15?/? embryos, 10.91 � 1.944, n = 11; P < .005, Student?s t test). G, Number of apoptotic HSPCs in CHT at 48 hpf (wildtype, 0.2 � 0.1333, n = 10; dhx15?/? embryos, 0.375 � 0.183, n = 8; P > .05, Student?s t test) and 60 hpf (wildtype, 0.125 � 0.08539, n = 16; dhx15?/? embryos, 0.1818 � 0.122, n = 11; P > .05, Student?s t test). H, Percentages of proliferating HSPCs in CHT at 48 hpf (wildtype, 11.34 � 2.379, n = 9; dhx15?/? embryos, 13.98 � 1.829, n = 11; P > .05, Student?s t test) and 60 hpf (wildtype, 7.464 � 0.9413, n = 11; dhx15?/? embryos, 2.367 � 0.6178, n = 9; P < .0005, Student?s t test). Data are represented as mean � SEM. *P < .05; **P < .005; ***P < .0005. Scale bar = 40 ?m. CHT, caudal hematopoietic tissue; hpf, hours post fertilization; HSPCs, hematopoietic stem/progenitor cells; ns, not significant; pH3, pospho?histone H3