Figure 4
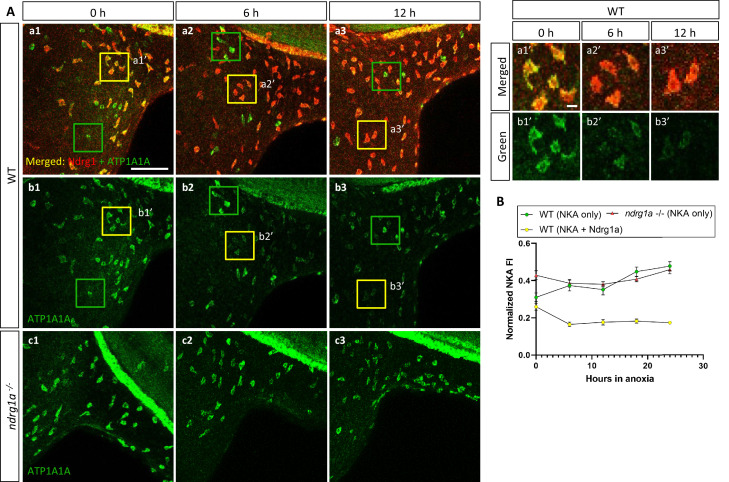
(A, left) Lateral views of WT embryos (a1?b3) and ndrg1a-/- mutants (c1?c3) exposed to anoxia for 0 hr (a1?c1), 6 hr (a2?c2), 12 hr (a3?c3) and immunolabeled with anti-ATP1A1A (green) and anti-Ndrg1a (red); (a1?a3) show merged channels, while (b1?c3) show the green (ATP1A1A) channel only. Annotations: yellow and green boxes identify ionocytes that are positive for Ndrg1a and ATP1A1A (yellow) or ATP1A1A-only (green). Scale bar: a1: 100 ?m; a1?: 2 ?m. (A, right) Higher magnification images of yellow boxed in areas in (a1-b3), showing merged channels (a1?-a3?) and green channel only (b1?-b3?). (B) Normalized fluorescence intensity of ATP1A1A in ionocytes of WT embryos and ndrg1a-/- mutants exposed to anoxia for 0, 6, 12, 18, and 24 hr. (n=3 experiments with an average of 37 ionocytes processed per experimental group; Figure 4?source data 1).
NKA is co-expressed with Ndrg1a in a subset of ionocytes and downregulated under anoxia in an ndrg1a-dependent manner.
Image
Figure Caption
Figure Data
Acknowledgments
This image is the copyrighted work of the attributed author or publisher, and
ZFIN has permission only to display this image to its users.
Additional permissions should be obtained from the applicable author or publisher of the image.
Full text @ Elife

