
Image
|
Figure Caption
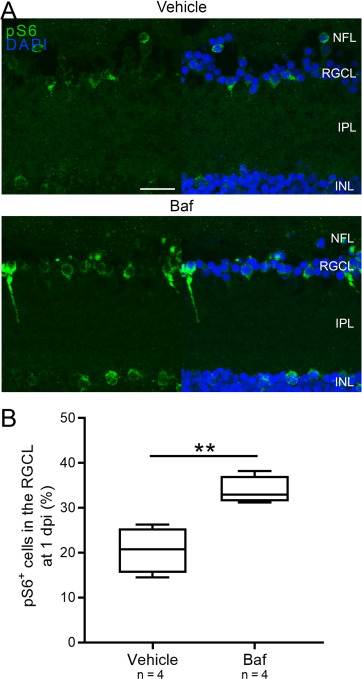
Fig. 12
Fig. 12. Visualization and quantification of the pS6+ cells one day after optic nerve damage and vehicle or bafilomycin A1 treatment. (A) Representative retinal images show more pS6+ cells one day after injury in the RGCL after bafilomycin treatment. (B) Quantification of the number of pS6+ cells confirms this finding. Scale bar = 20 �m. Representative images of n = 4. N = 4. Baf, bafilomycin A1; dpi, days post-injury; INL, inner nuclear layer; IPL, inner plexiform layer; NFL, nerve fiber layer; RGCL, retinal ganglion cell layer; pS6, phosphorylated S6.
Acknowledgments
This image is the copyrighted work of the attributed author or publisher, and
ZFIN has permission only to display this image to its users.
Additional permissions should be obtained from the applicable author or publisher of the image.
Full text @ Neuroscience