
|
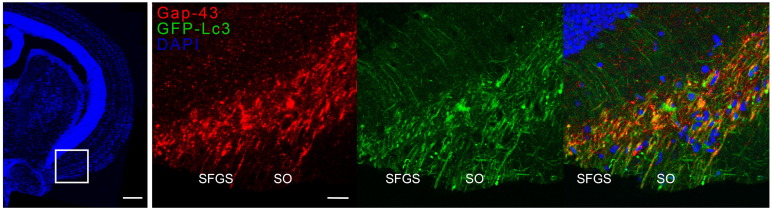
Fig. 8
Fig. 8. Immunostaining for Gap-43 on brain sections of GFP-Lc3 zebrafish at 6 dpi. Representative images reveal that in the optic tectum, the Gap-43+ (red) and Lc3+ (green) fluorescent signals largely co-localize (yellow-orange), as observed in the merged picture. Scale bars = 200 �m (DAPI overview) and 30 �m (zoom). Representative image of n = 4 Dpi, days post-injury; GFP; green fluorescent protein; Gap-43, growth-associated protein 43; Lc3, microtubule-associated protein 1A/1B-light chain 3; SFGS, stratum fibrosum et griseum superficiale; SO, stratum opticum. (For interpretation of the references to colour in this figure legend, the reader is referred to the web version of this article.)