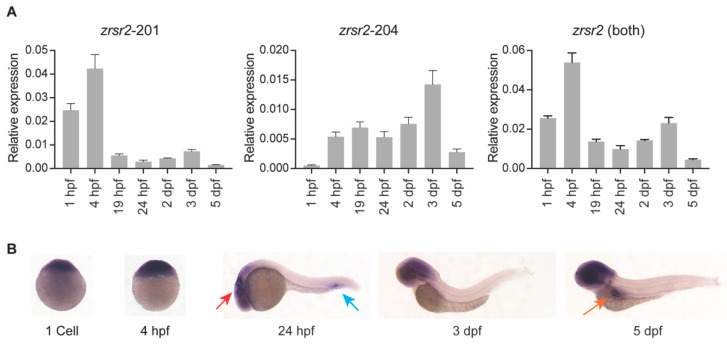
Fig. 2
zrsr2 expression during zebrafish embryonic development. (A) qRT-PCR data showing expression of zrsr2 isoforms using primers unique to each isoform, and total expression using primers common to both isoforms in WT embryos from a series of stages during development as marked across the bottom of each plot. (B) WISH with zrsr2 antisense probe, showing its sites of expression in WT embryos at 1 cell, 4 hpf, 24 hpf, 3 dpf, and 5 dpf as marked. Specific zrsr2 expression is seen in the developing brain (red arrow) and the peripheral blood island (blue arrow) at 24 hpf, and in the intestinal bulb (orange arrow) at 5 dpf.

