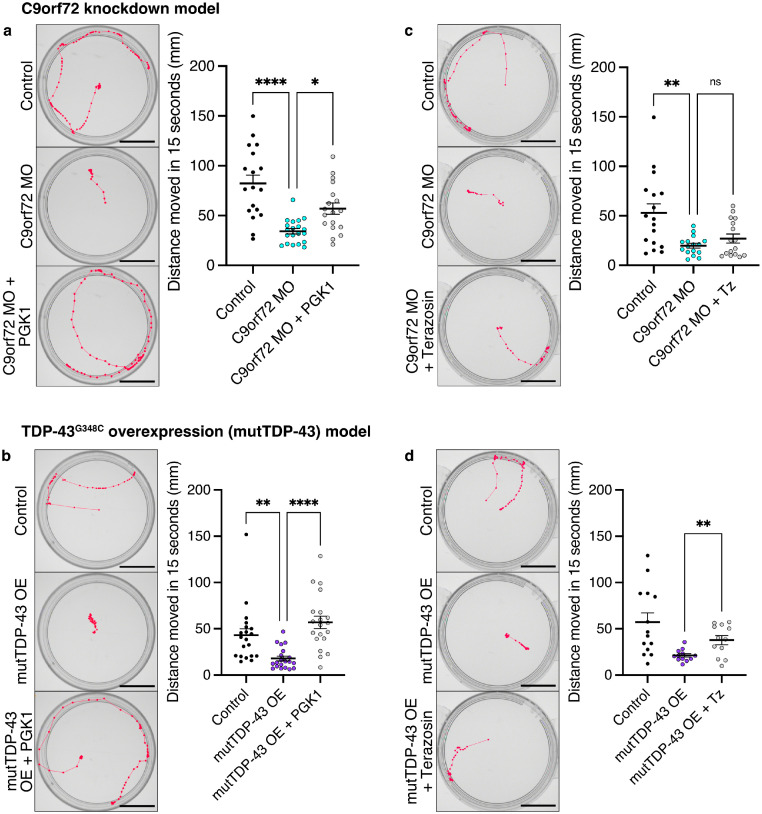
Fig. 2
Targeting PGK1 improves motor function in zebrafish ALS models at 72 hpf. (a) Results and representative path traces from the TEER (touch-evoked escape response) test in C9orf72 MO larvae following PGK1 overexpression show a significant increase in distance moved following a tail touch (One-way ANOVA P < 0.0001 with Tukey's multiple comparison test: Control vs C9orf72 MO P < 0.0001, C9orf72 MO vs C9orf72 + PGK1 OE P = 0.02). Scale bar=10 mm. (b) Results and representative path traces from the TEER (touch-evoked escape response) test in mutTDP43 OE larvae following PGK1 overexpression show a significant increase in distance moved following a tail touch (One-way ANOVA P < 0.0001 with Tukey's multiple comparison test: Control vs mutTDP-43 OE P = 0.009, mutTDP-43 OE vs mutTDP-43 OE + PGK1 OE P < 0.0001). Scale bar=10 mm. (c) Results and representative path traces from the TEER test in C9orf72 MO larvae following daily terazosin (Tz) shows no difference in distance moved (One-way ANOVA P = 0.001 with Tukey's multiple comparison test: Control vs C9orf72 MO P = 0.001, C9orf72 MO vs C9orf72 + Tz P = 0.70). Scale bar=10 mm. (d) Results and representative path traces from the TEER test in mutTDP-43 OE larvae following daily terazosin (Tz) treatment shows a significant increase in distance moved following a tail touch (unpaired t-test, P = 0.0047). Scale bar=10 mm. Each point represents the average of 3 trials from a single larva. n = 2 clutches, n = 12-20 per group. Error bars represent s.e.m., ns=non-significant, * = P < 0.05, ** = P < 0.01, **** = P < 0.0001.

