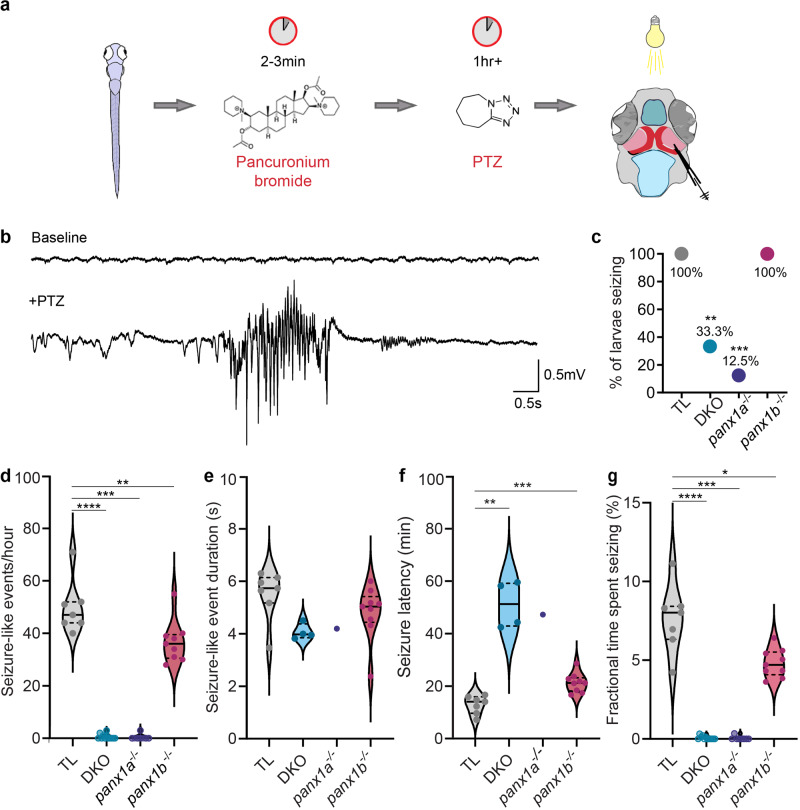
Fig. 1
a Workflow for recording in vivo local field potentials (LFP) from the right optic tectum (OT) of 7dpf anesthetized larva after 15 mM PTZ treatment. b Representative recording of baseline activity and a seizure-like event (SLE) induced with the addition of PTZ from a TL larva. c All TL and panx1b−/− larvae had SLEs (TL (gray) n = 7/7; DKO (light blue) n = 4/12, P = 4.5 × 10⁻³; panx1a−/− (deep blue) n = 1/8, P = 3.0 × 10⁻⁴; panx1b−/− (magenta) n = 9/9, P = 1.0, Barnard test). d Quantification of SLEs in the first hour of LFP recording revealed that all panx1 knockout (KO) larvae had a significant reduction in SLEs compared to PTZ treated TL controls, presented as an average number of SLEs/hour ± s.e.m. (DKO: P = < 1.0 × 10⁻⁴; panx1a−/−: P = 3.0 × 10⁻⁴; panx1b−/−P = 5.7 × 10⁻³). e The average duration of SLEs (in seconds ± s.e.m.) for each genotype was not significantly different compared to TLs. Statistical tests were not significant for panx1a−/− due to lack of statistical power. (DKO: P = 0.07; panx1b−/−: P = 0.09). f All panx1 knockout larvae had a significant delay in the average onset time (minutes ± s.e.m.) of the first seizure-like event compared to PTZ treated TL controls. (DKO: P = 6.1 × 10⁻³; panx1b−/−: P = 3.0 × 10⁻⁴). g All panx1 knockout larvae spent significantly less time seizing compared to PTZ treated TL controls. Average fractional time spent seizing is presented in percent ± s.e.m. (DKO: P = < 1.0 × 10⁻⁴; panx1a−/−: P = 3.0 × 10⁻⁴; panx1b−/−: P = 0.01). N = number of larvae. Statistical Mann–Whitney U test in (d–g). Scale bars 0.5 mV by 0.5 s. *P < 0.05, **P < 0.01, ***P < 0.001, ****P < 0.0001.

