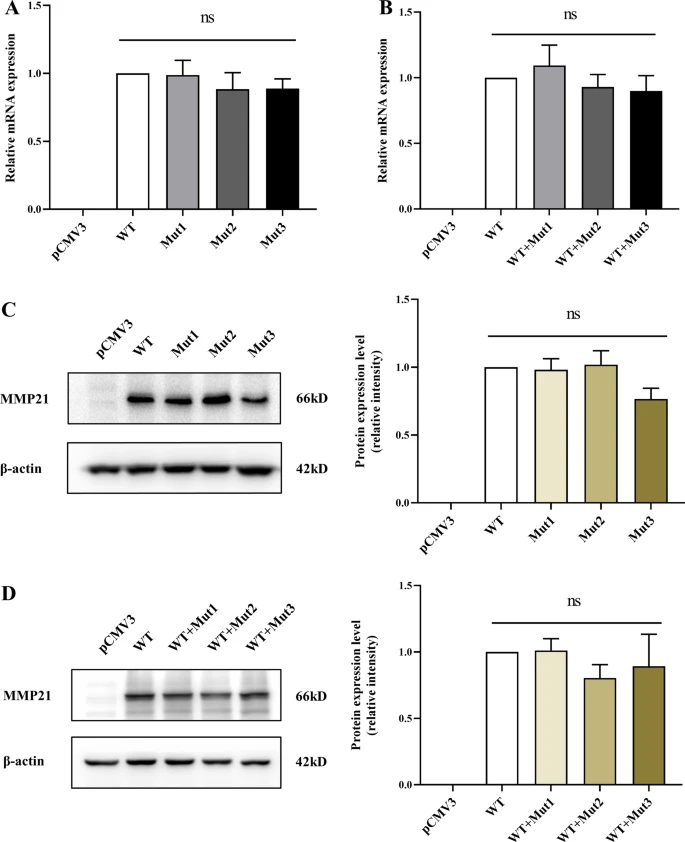
Fig. 2
The variants do not disrupt the expression of MMP21. The blank (pCMV3), MMP21 WT, or mutant vectors (Mut1, c.G731A; Mut2, c.C829T; Mut3, c.A1459G) were separately transfected or co-transfected (WT/mutant = 1:1) into HEK-293 T cells. A, B Relative mRNA expression of MMP21 in HEK-293 T cells transfected with plasmids for 36 h was assessed by RT-qPCR. 18sRNA was used as an internal control. The RNA levels in the WT group were set at 1. There was no significant difference in MMP21 mRNA expression between the WT and mutant groups (all data are shown as the mean ± SEM, and one-way ANOVA with Tukey?s multiple comparisons test was performed for statistical calculation of MMP21 mRNA expression between the WT and mutant groups, n = 3 independent experiments). C, D Relative MMP21 protein expression in HEK-293 T cells transfected with plasmids for 48 h was evaluated using western blot analysis. ?-Actin was used as an internal control (left panel). The intensity quantitation of MMP21 WT and mutant protein expression levels were normalized to ?-actin expression using ImageJ software (right panel). Quantitative results revealed no significant difference in MMP21 protein expression between WT and mutant groups (all data are shown as the mean ± SEM; one-way ANOVA with Tukey?s multiple comparisons test was used for statistical calculation of MMP21 protein expression between WT and mutant groups, n = 3 independent experiments)

