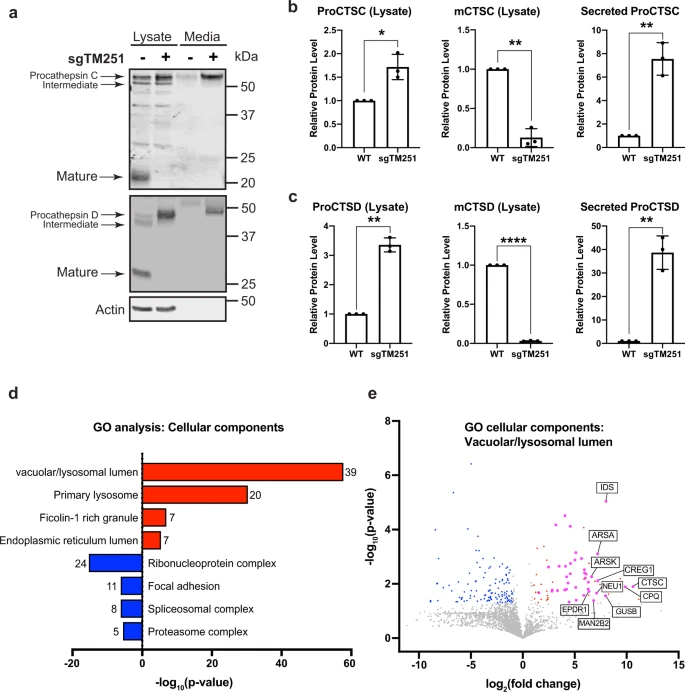
Fig. 4
a CTSC and CTSD protein level in the whole cell lysate and conditioned media of HEK293 WT and sgTMEM251 cells. b, c Quantification of CTSC and CTSD protein levels in a. Mean of 3 independent replicates is shown. Error bars represent standard deviation. *p ? 0.05, **p ? 0.01, ****p ? 0.0001. See source data file for exact P values. d GO enrichment analysis of secreted proteins altered in sgTMEM251 (n = 3 independent replicates) vs. control (n = 3 independent replicates) cells. The number of proteins in each pathway is indicated. e Volcano plot of secretome analysis of sgTMEM251 (n = 3 independent replicates) vs. control (n = 3 independent replicates) cells. Annotated genes are the top 10 candidates in vacuolar/lysosomal lumenal components.

