
|
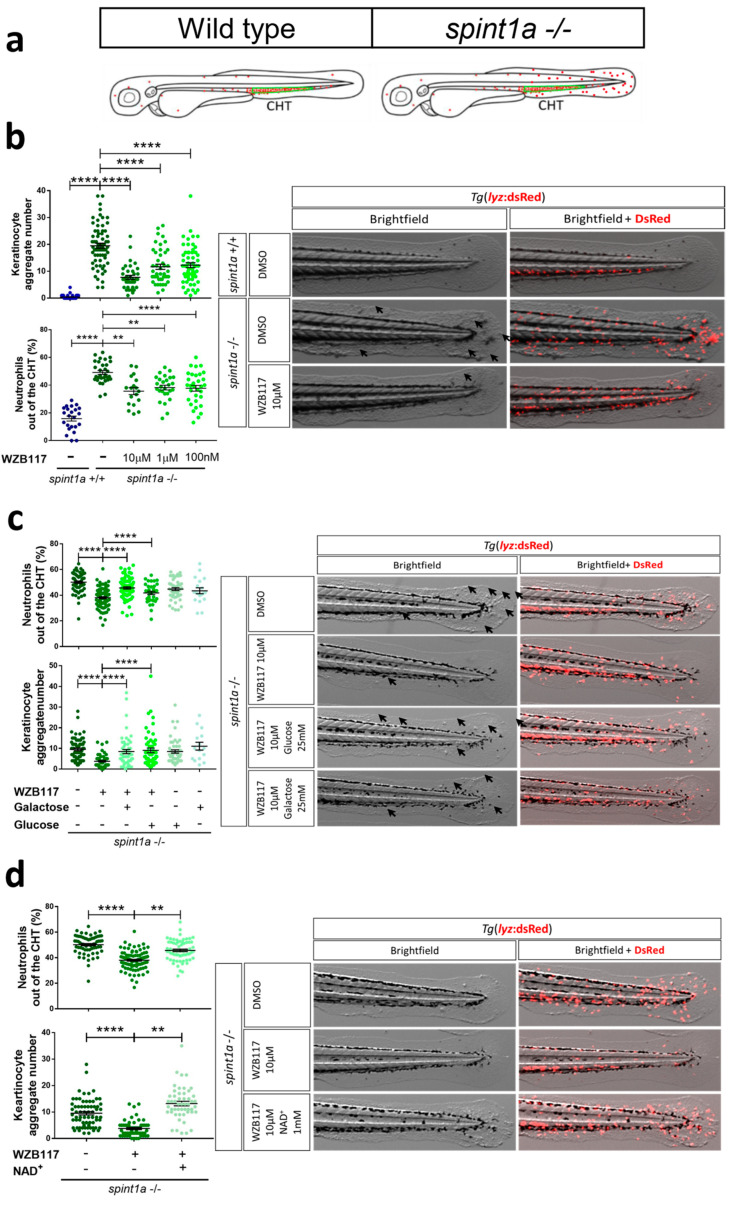
Fig. 6
Impact of glucose in zebrafish models of diabetic comorbidity in psoriasis. (a) Scheme showing the distribution of neutrophils in wild type and Spint1a-deficient zebrafish larvae. (b?d) Representative bright field and merge (bright field and red fluorescence) images and quantitation of skin neutrophil infiltration and the number of keratinocyte aggregates (arrows) in 3 dpf larvae treated with 10 µM WZB117 for 48 h in the presence or absence of 25 mM glucose or galactose (c), or 1 mM NAD+ (d). Each dot represents one individual, and the mean ± SEM for each group is also shown. p-Values were calculated using 1-way ANOVA and Tukey multiple range test. ns, not significant, ** p ? 0.01, *** p ? 0.001, **** p ? 0.0001.