
|
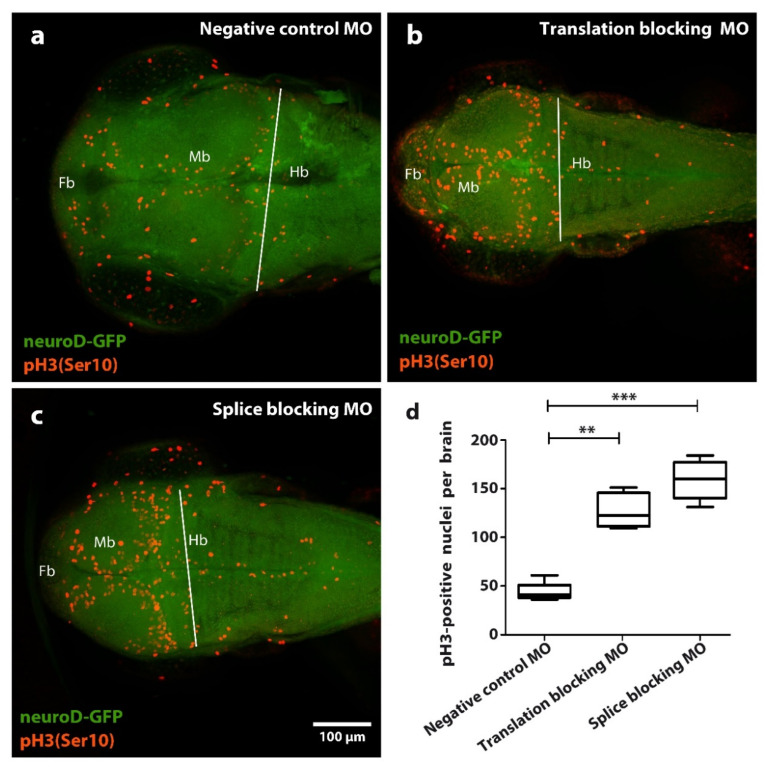
Fig. 3
Effect of tubgcp2 knockdown using microinjection of morpholino antisense oligonucleotides (MOs) blocking either splicing or translation, on number of pH3/Ser10) immunoreactive (IR) nuclei in zebrafish brain tissue at 3 dpf. Immunohistochemical staining of Tg(neuroD:GFP) larvae 2 dpf (green): pH3 (Ser 10) (red) shows distribution of pH3 (Ser 10) IR nuclei in (a) control, (b) translation-blocking MO, and (c) splice-blocking MO-treated groups within the forebrain (Fb), midbrain (Mb), and hindbrain (Hb). (d) Quantification of pH3 (Ser 10) IR nuclei in larvae at 2 dpf. Quantifications derive from Fb + Mb areas within limit (white line) lying along midbrain-hindbrain border. Statistical test one-way ANOVA and Kruskal?Wallis analysis was completed using GraphPad Prism 5; ** p ? 0.01, *** p ? 0.001. Compared to the control group (a), translation-blocking MO injection (b) results in an approximate 3-fold increase of pH3 (Ser 10) IR nuclei, whereas splice-blocking MO injection (c) results in a near 4-fold increase of pH3 (Ser 10) IR nuclei.