
|
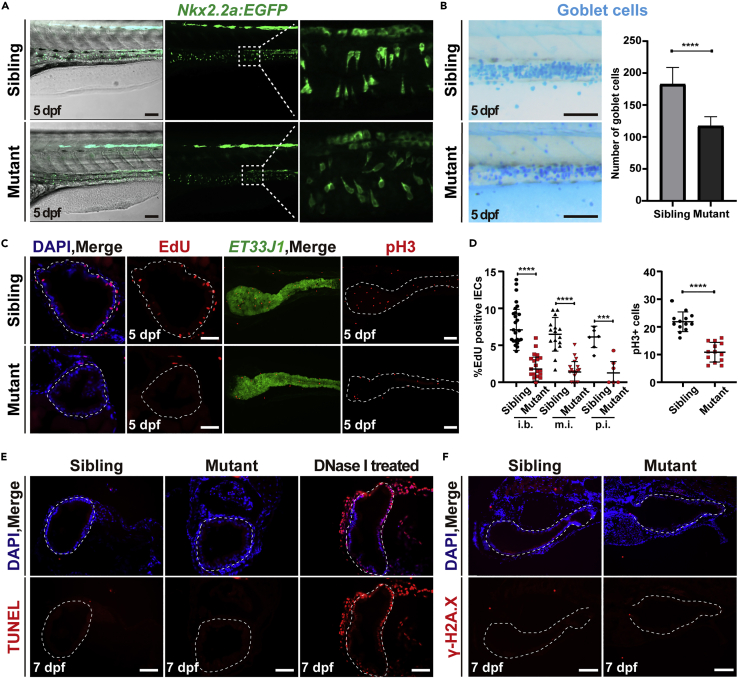
Fig. 4
Ercc2/Xpd-deficient intestinal endothelial cells exhibit loss of cell polarity and impaired proliferation
(A) Tg(Nkx2.2a:EGFP) marked intestinal endocrine cells in ercc2/xpd mutants and siblings at 5 dpf. Scale bars, 100 ?m.
(B) Alcian blue staining showed intestinal goblet cells (left) and quantification of their numbers (right) in ercc2/xpd mutants and siblings at 5 dpf. Scale bars, 100 ?m. Data are presented as mean � SD. Student?s t test, ????, p < 0.0001.
(C) EdU incorporation assay and immunostaining of the mitotic marker phospho-histone H3 revealed reduced the proliferation of intestinal endothelial cells (IECs) in ercc2/xpd mutants compared to siblings at 5 dpf. Scale bars, 100 ?m.
(D) Quantification of percentages of EdU-positive IECs or pH3-positive cells in different regions of the intestine. i.b., intestinal bulb; m.i., mid-intestine; p.i., posterior intestine. Data are presented as mean � SD, Student?s t test, ????, p < 0.0001, ???, p < 0.001. See also Figure S4D.
(E) The TUNEL assay showed no detectable apoptotic signals in IECs in ercc2/xpd mutants and siblings compared to the DNase-I-treated positive control at 7 dpf. Scale bars, 100 ?m. See also Figure S5A.
(F) Immunostaining of ?-H2A.X revealed no increased apoptosis or DNA instability in IECs in ercc2/xpd mutants compared to siblings at 7 dpf. Scale bars, 100 ?m.