
|
Fig. 4
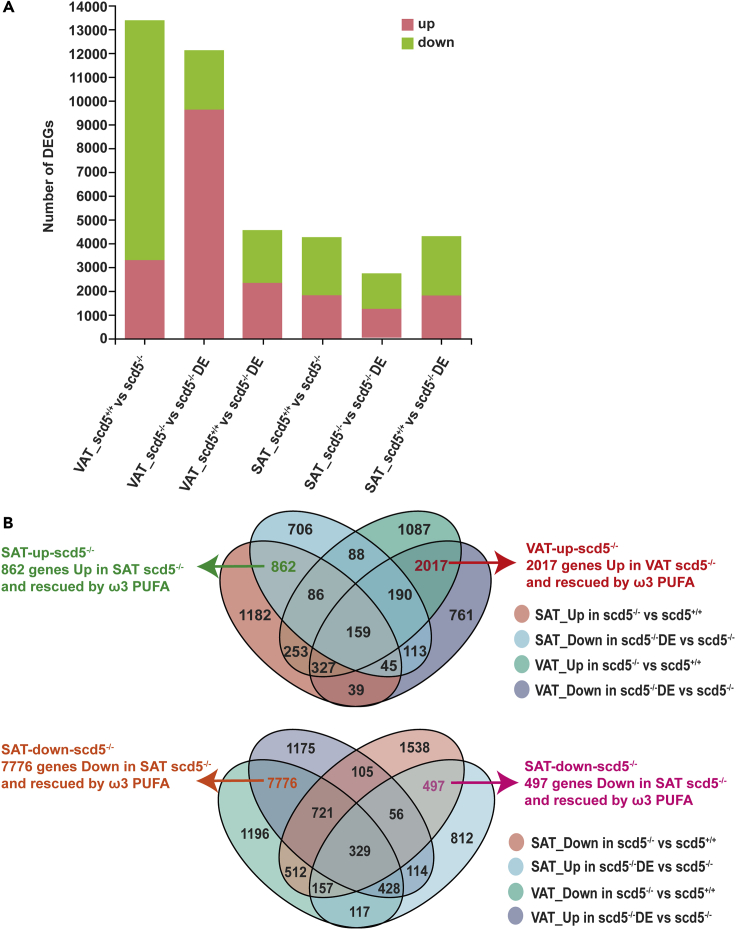
Transcriptome analysis of VAT of scd5?/? and scd5?/? DE
(A) Histogram of number of DEGs obtained from the comparative analysis between the six samples. Pink square indicates upregulated, green square indicates downregulated (n = 2).
(B) Venn analysis of DEGs. Each elliptical box represents different gene groups. Four genes sets were obtained by intersection. VAT-up-scd5?/? (2017 genes which were upregulated in VAT sample of scd5?/? compared to scd5+/+, restored in VAT sample of scd5?/? DE, and not significantly different in SAT samples of all three strains) , VAT-down-scd5?/? (7,776 genes which were downregulated in the VAT of scd5?/? compared to scd5+/+, restored in the VAT of scd5?/? DE, and have no significantly difference in the SAT of scd5?/? and scd5?/? DE), SAT-up-scd5?/? (862 genes which were upregulated in the SAT of scd5?/? compared to scd5+/+ and restored in the SAT of scd5?/? DE, and have no significantly difference in the VAT of all three strains), and SAT-down-scd5?/? (497 genes which were downregulated in the SAT of scd5?/? compared to scd5+/+, restored in the SAT of scd5?/? DE, and have no significantly difference in the VAT of scd5?/? and scd5?/? DE).