Fig. 4
Image
Figure Caption
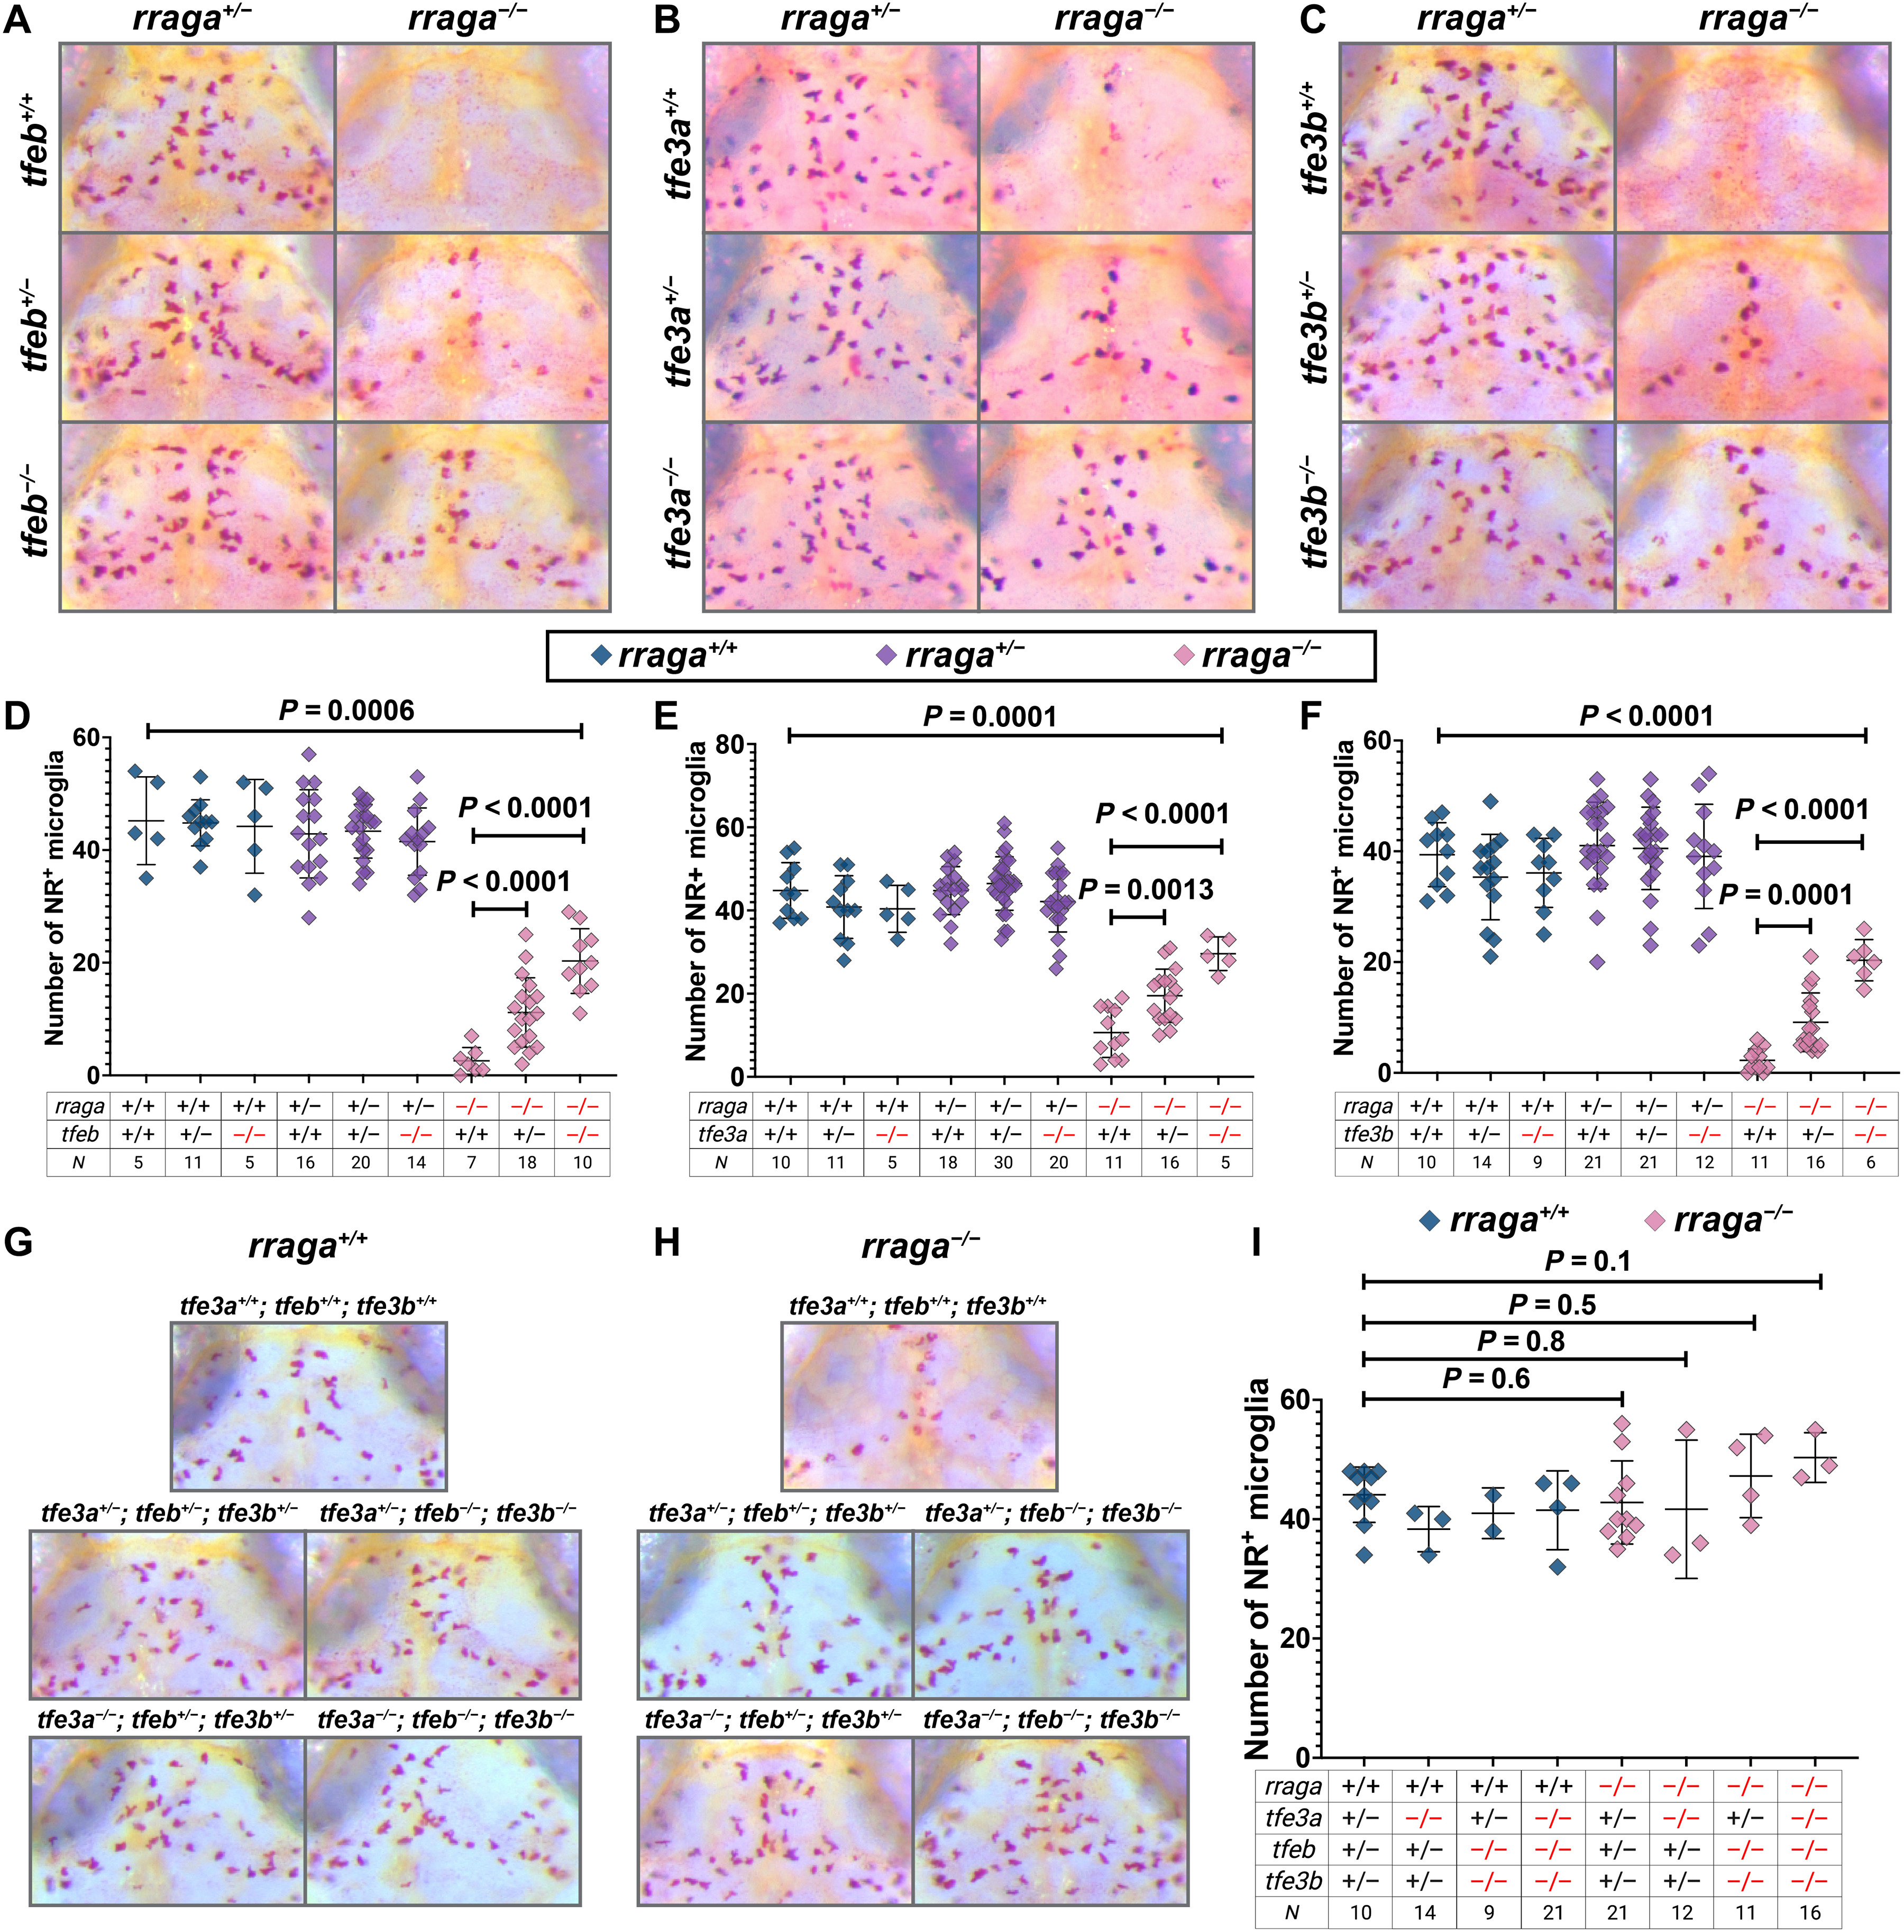
Fig. 4. Microglia numbers are restored in rraga mutants with simultaneous mutation of tfeb, tfe3a, or tfe3b.
Images show dorsal views of the midbrain (anterior on top) of neutral red (NR)–stained larvae of indicated genotypes at 5 dpf, and graphs show corresponding quantification. (A and D) Progeny from rraga+/−; tfeb+/− intercross, (B and E) Progeny from rraga+/−; tfe3a+/− intercross. (C and F) Progeny from rraga+/−; tfe3b+/− intercross. (G to I) Progeny from rraga+/−; tfeb+/−; tfe3a+/−; tfe3b+/− quadruple heterozygous intercross. Images of a rraga mutant and tfeb and tfe3 genotypes that result in complete rescue of NR+ microglia in rraga mutants are shown in (H). In (G), the same genotypes, but in a background wild-type for rraga, are included for comparison. All graphs show mean + SD; significance was determined using parametric unpaired t test. The number of animals analyzed for each experiment is listed in the tables below each graph; (A) to (F) are representative of at least two independent experiments.
Figure Data
Acknowledgments
This image is the copyrighted work of the attributed author or publisher, and
ZFIN has permission only to display this image to its users.
Additional permissions should be obtained from the applicable author or publisher of the image.
Full text @ Sci Adv

