
|
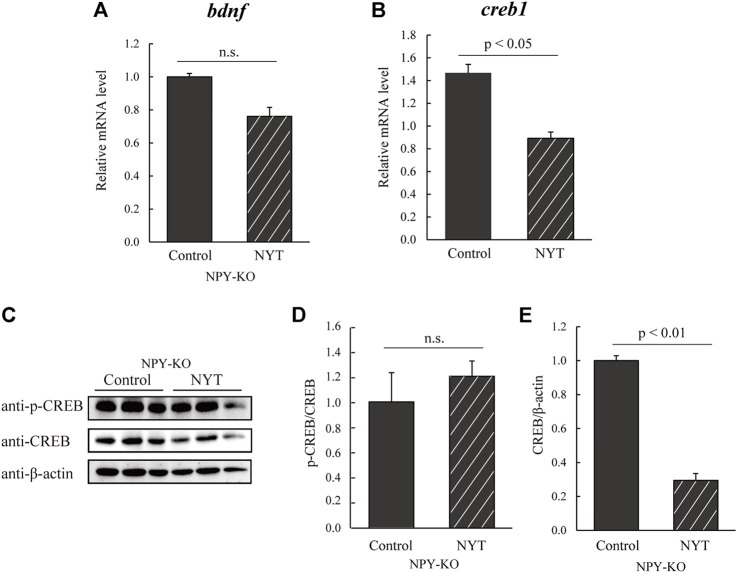
Fig. 5
Effect of NYT on BDNF/CREB in NPY-KO zebrafish. The mRNA levels of bdnf and creb1 were estimated by real-time PCR using the whole brain of the control?and NYT-fed NPY-KO zebrafish. (A) bdnf. (B) creb1. The gene expression level of actb was used as an internal reference. Each gene expression level was relative to that in the control-fed NPY-KO zebrafish. n = 5. The protein levels of (C,D) p-CREB and (C,E) CREB were analyzed using immunoblotting with whole-brain lysates of control?and NYT-fed NPY-KO zebrafish. The loading control used was (D) total CREB and (E) ?-actin. n = 4. Results are shown as mean � standard error of the mean. n.s., not significant.